

Question: Observations and Data: [5 marks] Graph Plotting: Using Microsoft Excel or MATLAB, draw a graph of -. (-axis) against ma (x-axis). Label your axes Section
![Observations and Data: [5 marks] Graph Plotting: Using Microsoft Excel or](https://dsd5zvtm8ll6.cloudfront.net/si.experts.images/questions/2024/09/66f6a532c69d1_17866f6a532a6d97.jpg)
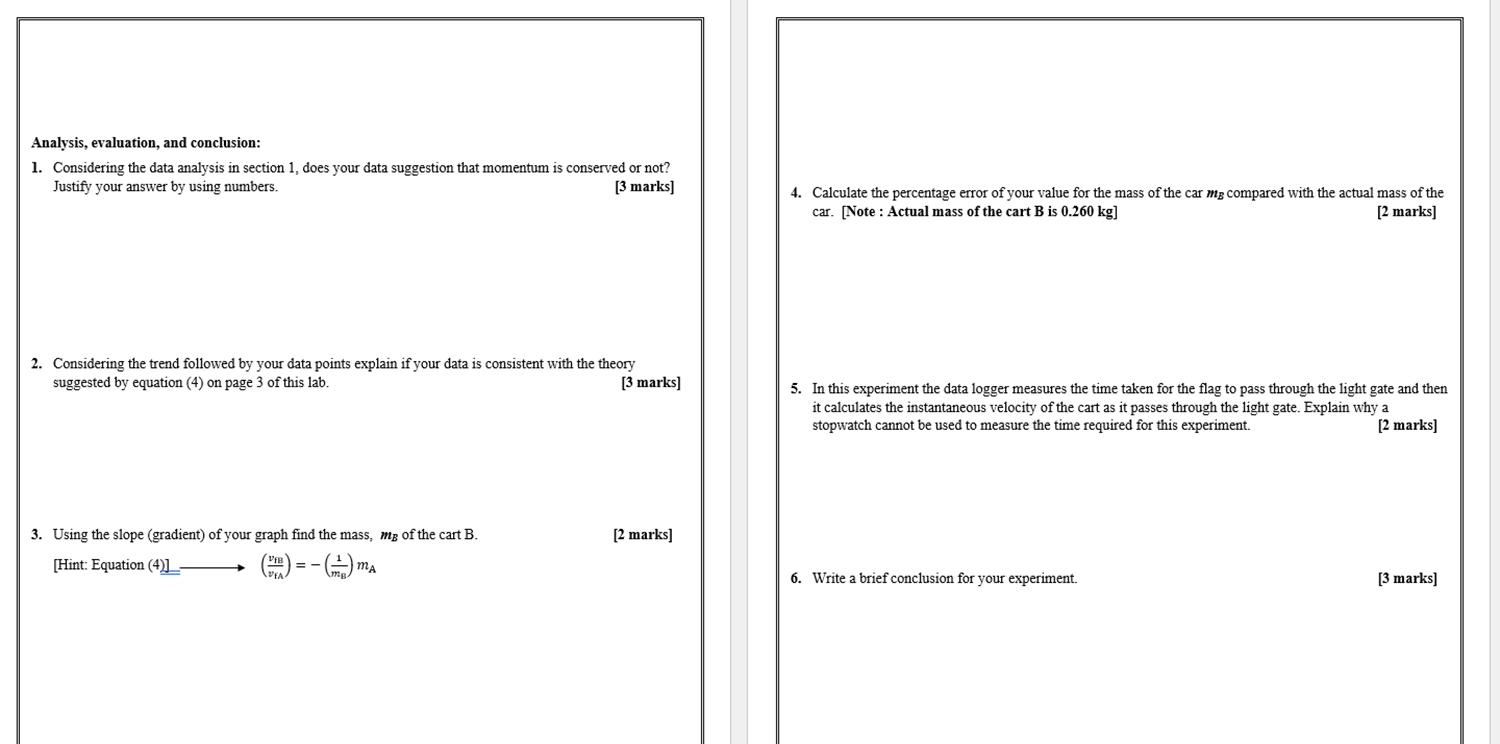
Observations and Data: [5 marks] Graph Plotting: Using Microsoft Excel or MATLAB, draw a graph of -. (-axis) against ma (x-axis). Label your axes Section 1: with the correct quantities and correct units. Show the calculations below for the first trial. Draw the line of best fit for your data. In Excel this is called trendline. Measure the mass of the cart A mA: 0.260kg Measure the mass of the cart B. me: 0.260kg Use Excel or MATLAB to find the equation of the best fit line. Equation: y =-3.9322x + 0.0928 [1 mark] Initial velocity of the cart A, Via: 0 Record the gradient (slope) of your line. Initial velocity of the cart B, ViB :0 Gradient (slope) of the line: -3.9322 [1 mark] Final velocity of the cart A_VIA: -0.5602m/s Final velocity of the cart B, VB: 0.5780m/s Copy your graph from Excel/MATLAB and paste here. [8 marks] Total momentum before release: 0 Total momentum after release: mAVEA + mgVB =0.004628 CONSERVATION OF MOMENTUM Section 2: 0 0.1 0.2 0.3 0.4 0.5 0.6 Record your measurements in table below. 0.5 Mass of cart A, MA Final velocity of cart A, UfA Final velocity of cart B, VFB kg m/s n/s VEA -1 v fB/v fA 0.260 -0.5780 0.5602 -0.9692 -15 0.310 -0.4878 0.5222 -1.0705 0.360 -0.4292 0.5495 -1.2802 y =-3.9322x + 0.0928 -2 0.410 -0.3724 0.5865 -1.5749 0.460 -0.3396 0.5970 -1.7579 -2.5 Mass of cart ma 0.510 -0.3195 0.5988 -1.8741Analysis, evaluation, and conclusion: 1. Considering the data analysis in section 1, does your data suggestion that momentum is conserved or not? Justify your answer by using numbers. [3 marks] 4. Calculate the percentage error of your value for the mass of the car my compared with the actual mass of the car. [Note : Actual mass of the cart B is 0.260 kg] [2 marks] 2. Considering the trend followed by your data points explain if your data is consistent with the theory suggested by equation (4) on page 3 of this lab. [3 marks] 5. In this experiment the data logger measures the time taken for the flag to pass through the light gate and then it calculates the instantaneous velocity of the cart as it passes through the light gate. Explain why a stopwatch cannot be used to measure the time required for this experiment. [2 marks] 3. Using the slope (gradient) of your graph find the mass, my of the cart B. [2 marks] [Hint: Equation (4)] (") = - (m) MA 6. Write a brief conclusion for your experiment. [3 marks]
Step by Step Solution
There are 3 Steps involved in it

Get step-by-step solutions from verified subject matter experts