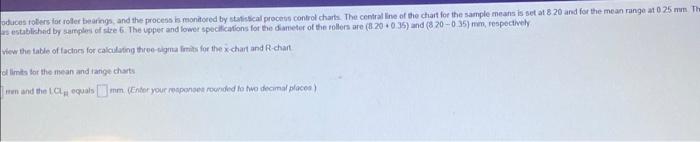
Question: oduces rollers for roller bearings, and the process is monitored by statistical process control charts. The central line of the chart for the sample means

oduces rollers for roller bearings, and the
oduces rollers for roller bearings, and the process is monitored by statistical process control charts. The central line of the chart for the sample means is set at 8 20 and for the mean range at 0 25 mm The as established by samples of size 6. The upper and lower specifications for the diameter of the rollers are (8.20+0.35) and (820-0.35) mm, respectively view the table of factors for calculating three-sigma limits for the x-chart and R-chart of limits for the mean and range charts men and the LCL equalsmm. (Enter your responses rounded to two decimal places) Size of Sample Factor for UCL and LCL for x-chart (A) (n) 2 1.880 1.023 0.729 0.577 0.483 0.419 0.373 0.337 0.308 3 Factors for calculating three-sigma limits for the x-chart and R-chart Factor for LCL for R-Chart (D3) 0 0 8 9 10 0 0 0 0.076 0.136 0.184 0.223 Factor for UCL for R-Chart (D) 3.267 2.575 2.282 2.115 2.004 1.924 1.864 1.816 1.777

Step by Step Solution

There are 3 Steps involved in it

1 Expert Approved Answer
Step: 1 Unlock blur-text-image
Question Has Been Solved by an Expert!

Get step-by-step solutions from verified subject matter experts

Step: 2 Unlock
Step: 3 Unlock

Students Have Also Explored These Related General Management Questions!