

Question: Often, frequency distributions are reported using unequal class widths because the frequencies of some groups would otherwise be small or very large. Consider the following
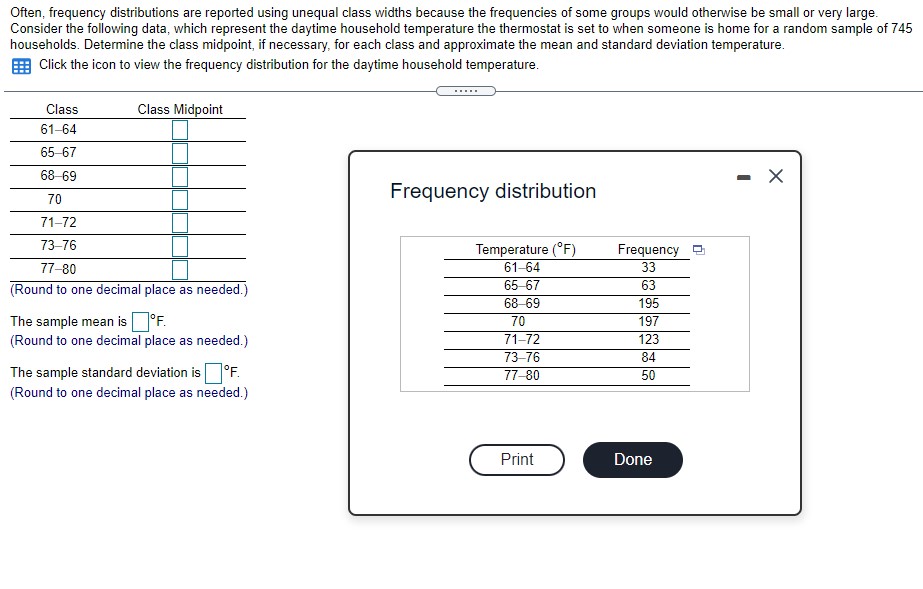
Often, frequency distributions are reported using unequal class widths because the frequencies of some groups would otherwise be small or very large. Consider the following data, which represent the daytime household temperature the thermostat is set to when someone is home for a random sample of 745 households. Determine the class midpoint, if necessary, for each class and approximate the mean and standard deviation temperature. Click the icon to view the frequency distribution for the daytime household temperature. Class Class Midpoint 61-64 65-67 68-69 = X 70 Frequency distribution 71-72 73-76 Temperature ('F) Frequency 77-80 61-64 33 (Round to one decimal place as needed.) 65-67 63 68-69 195 The sample mean is F. 70 197 (Round to one decimal place as needed.) 71-72 123 73-76 84 The sample standard deviation is OF. 77-80 50 (Round to one decimal place as needed.) Print Done
Step by Step Solution
There are 3 Steps involved in it

Get step-by-step solutions from verified subject matter experts