

Question: ok ces AA 17-3 Extended Analysis LO A1 Key figures for Samsung follow (in $ millions). Cash and equivalents Accounts receivable, net Inventories Retained
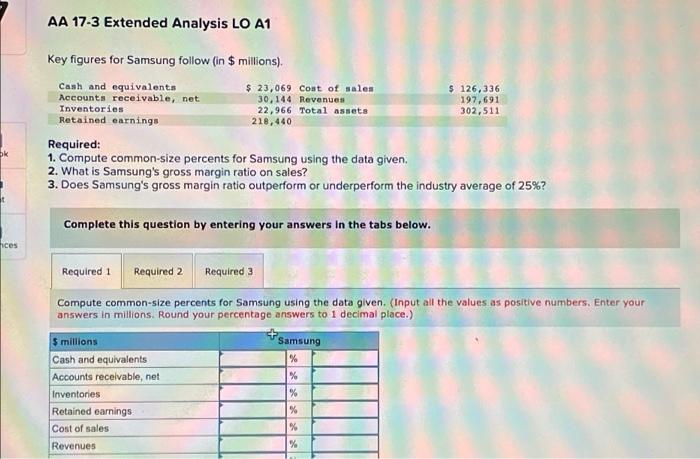
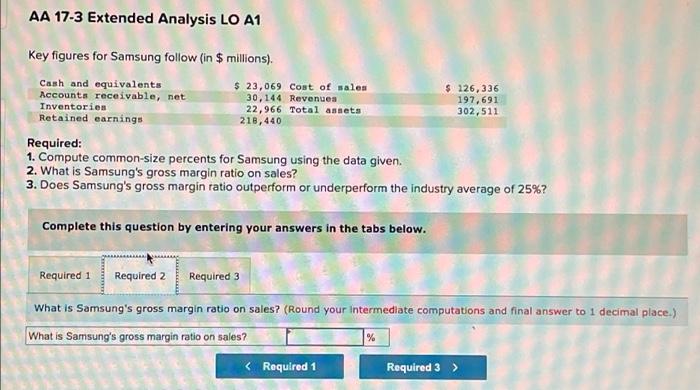
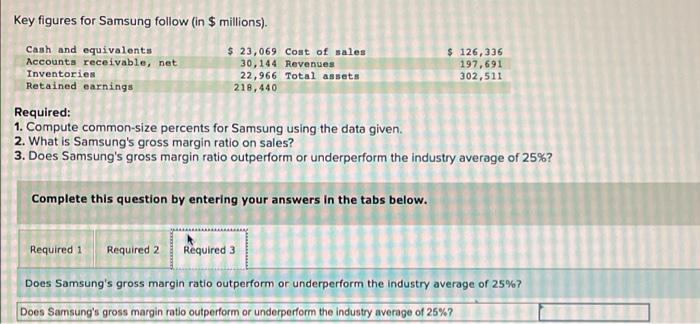
ok ces AA 17-3 Extended Analysis LO A1 Key figures for Samsung follow (in $ millions). Cash and equivalents Accounts receivable, net Inventories Retained earnings Required: $ 23,069 Cost of sales 30,144 Revenues 22,966 Total assets 218,440 $ 126,336 197,691 302,511 1. Compute common-size percents for Samsung using the data given. 2. What is Samsung's gross margin ratio on sales? 3. Does Samsung's gross margin ratio outperform or underperform the industry average of 25%? Complete this question by entering your answers in the tabs below. Required 1 Required 2 Required 3 Compute common-size percents for Samsung using the data given. (Input all the values as positive numbers. Enter your answers in millions. Round your percentage answers to 1 decimal place.) $ millions Cash and equivalents Accounts receivable, net Inventories Retained earnings Cost of sales Revenues Samsung % % % % % %
Step by Step Solution
There are 3 Steps involved in it

Get step-by-step solutions from verified subject matter experts