

Question: Old MathJax webview Obtain the above graph by editing the given PYTHON code: import matplotlib.pyplot as plt import numpy as np b=3 p=[-5, -4 -3,
Old MathJax webview
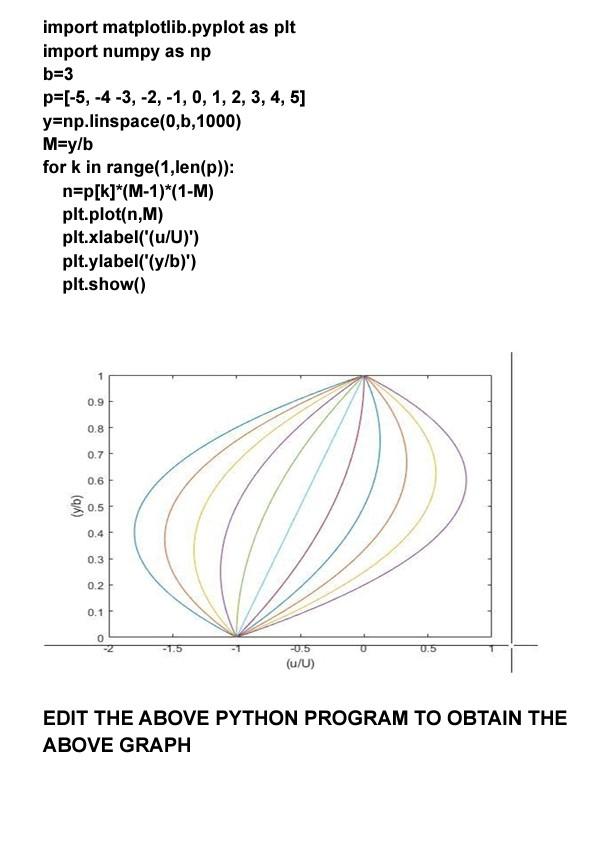
Obtain the above graph by editing the given PYTHON code:
import matplotlib.pyplot as plt import numpy as np
b=3 p=[-5, -4 -3, -2, -1, 0, 1, 2, 3, 4, 5] y=np.linspace(0,b,1000) M=y/b
for k in range(1,len(p)):
n=p[k]*(M-1)*(1-M) plt.plot(n,M) plt.xlabel('(u/U)') plt.ylabel('(y/b)') plt.show()
![-3, -2, -1, 0, 1, 2, 3, 4, 5] y=np.linspace(0,b,1000) M=y/b for](https://dsd5zvtm8ll6.cloudfront.net/si.experts.images/questions/2024/09/66f543c0d6ab0_69666f543c048fb4.jpg)
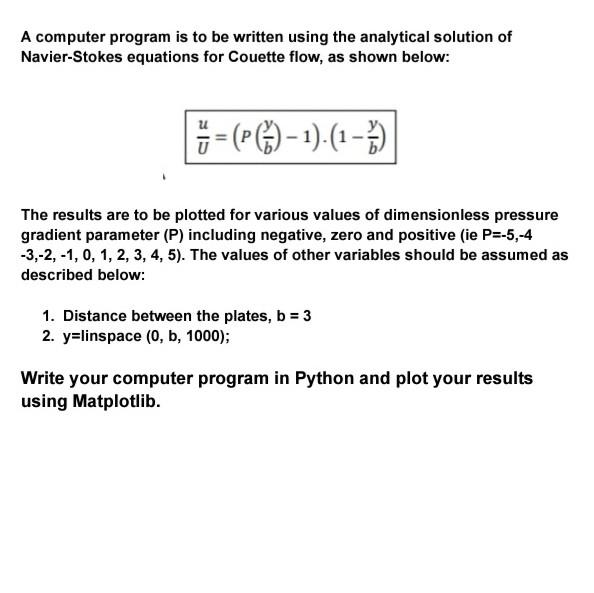
MATLAB PROGRAM IS GIVEN, CONVERT THE MATLAB PROGRAM INTO PYTHON CODE TO OBTAIN THE GIVEN GRAPH
import matplotlib.pyplot as plt import numpy as np b=3 p=(-5, -4 -3, -2,-1,0, 1, 2, 3, 4, 5] y=np.linspace(0,b, 1000) M=y/b for k in range(1,len(p)): n=p[k]*(M-1)*(1-M) plt.plot(n,M) plt.xlabel('(u/U)') plt.ylabel('(y/b)') plt.show() 1 0.9 0.8 0.7 0.6 0.5 0.4 0.3 0.2 0.1 0 -0.5 0.5 (u/U) EDIT THE ABOVE PYTHON PROGRAM TO OBTAIN THE ABOVE GRAPH A computer program is to be written using the analytical solution of Navier-Stokes equations for Couette flow, as shown below: 8 =(PC)-1).(-) The results are to be plotted for various values of dimensionless pressure gradient parameter (P) including negative, zero and positive (ie P=-5,-4 -3,-2,-1, 0, 1, 2, 3, 4, 5). The values of other variables should be assumed as described below: 1. Distance between the plates, b = 3 2. y=linspace (0, b, 1000); Write your computer program in Python and plot your results using Matplotlib. clc clear all %Roll Number ME-136 %B=3 %The top plate is stationary and bottom plate moves in negative direction %B=b=3 b=3; P=[-5, -4 -3, -2,-1,0, 1, 2, 3, 4, 5); y=linspace (0, b, 1000); M=y/b; for k=1:length(P) N=(P (k). *M-1). *(1-M); %N=u/U plot (NM) hold on end xlabel('(u/U)') ylabel ('(y/b)') gtext ('P= -5');gtext ('P= -4');gtext ('P= -3');gtext('P= -2');gtext('P= -1');gtext('P= 0');gtext('P= 1');gtext('P= 2');gtext('P= 3');gtext('P= 4);gtext('P=5'); CONVERT THE ABOVE MATLAB CODE TO PYTHON CODE
Step by Step Solution
There are 3 Steps involved in it

Get step-by-step solutions from verified subject matter experts