

Question: On a pivot table, I have to look at data and just create on a column 5 rows of 5 different sectors... ex) energy, financials
On a pivot table, I have to look at data and just create on a column 5 rows of 5 different sectors... ex) energy, financials etc..., I just need to learn how to put 1 total of 20 different energy companies on 1 row of a dollar figure. Once I learn what to do on excel for one I can do the rest of the 4.
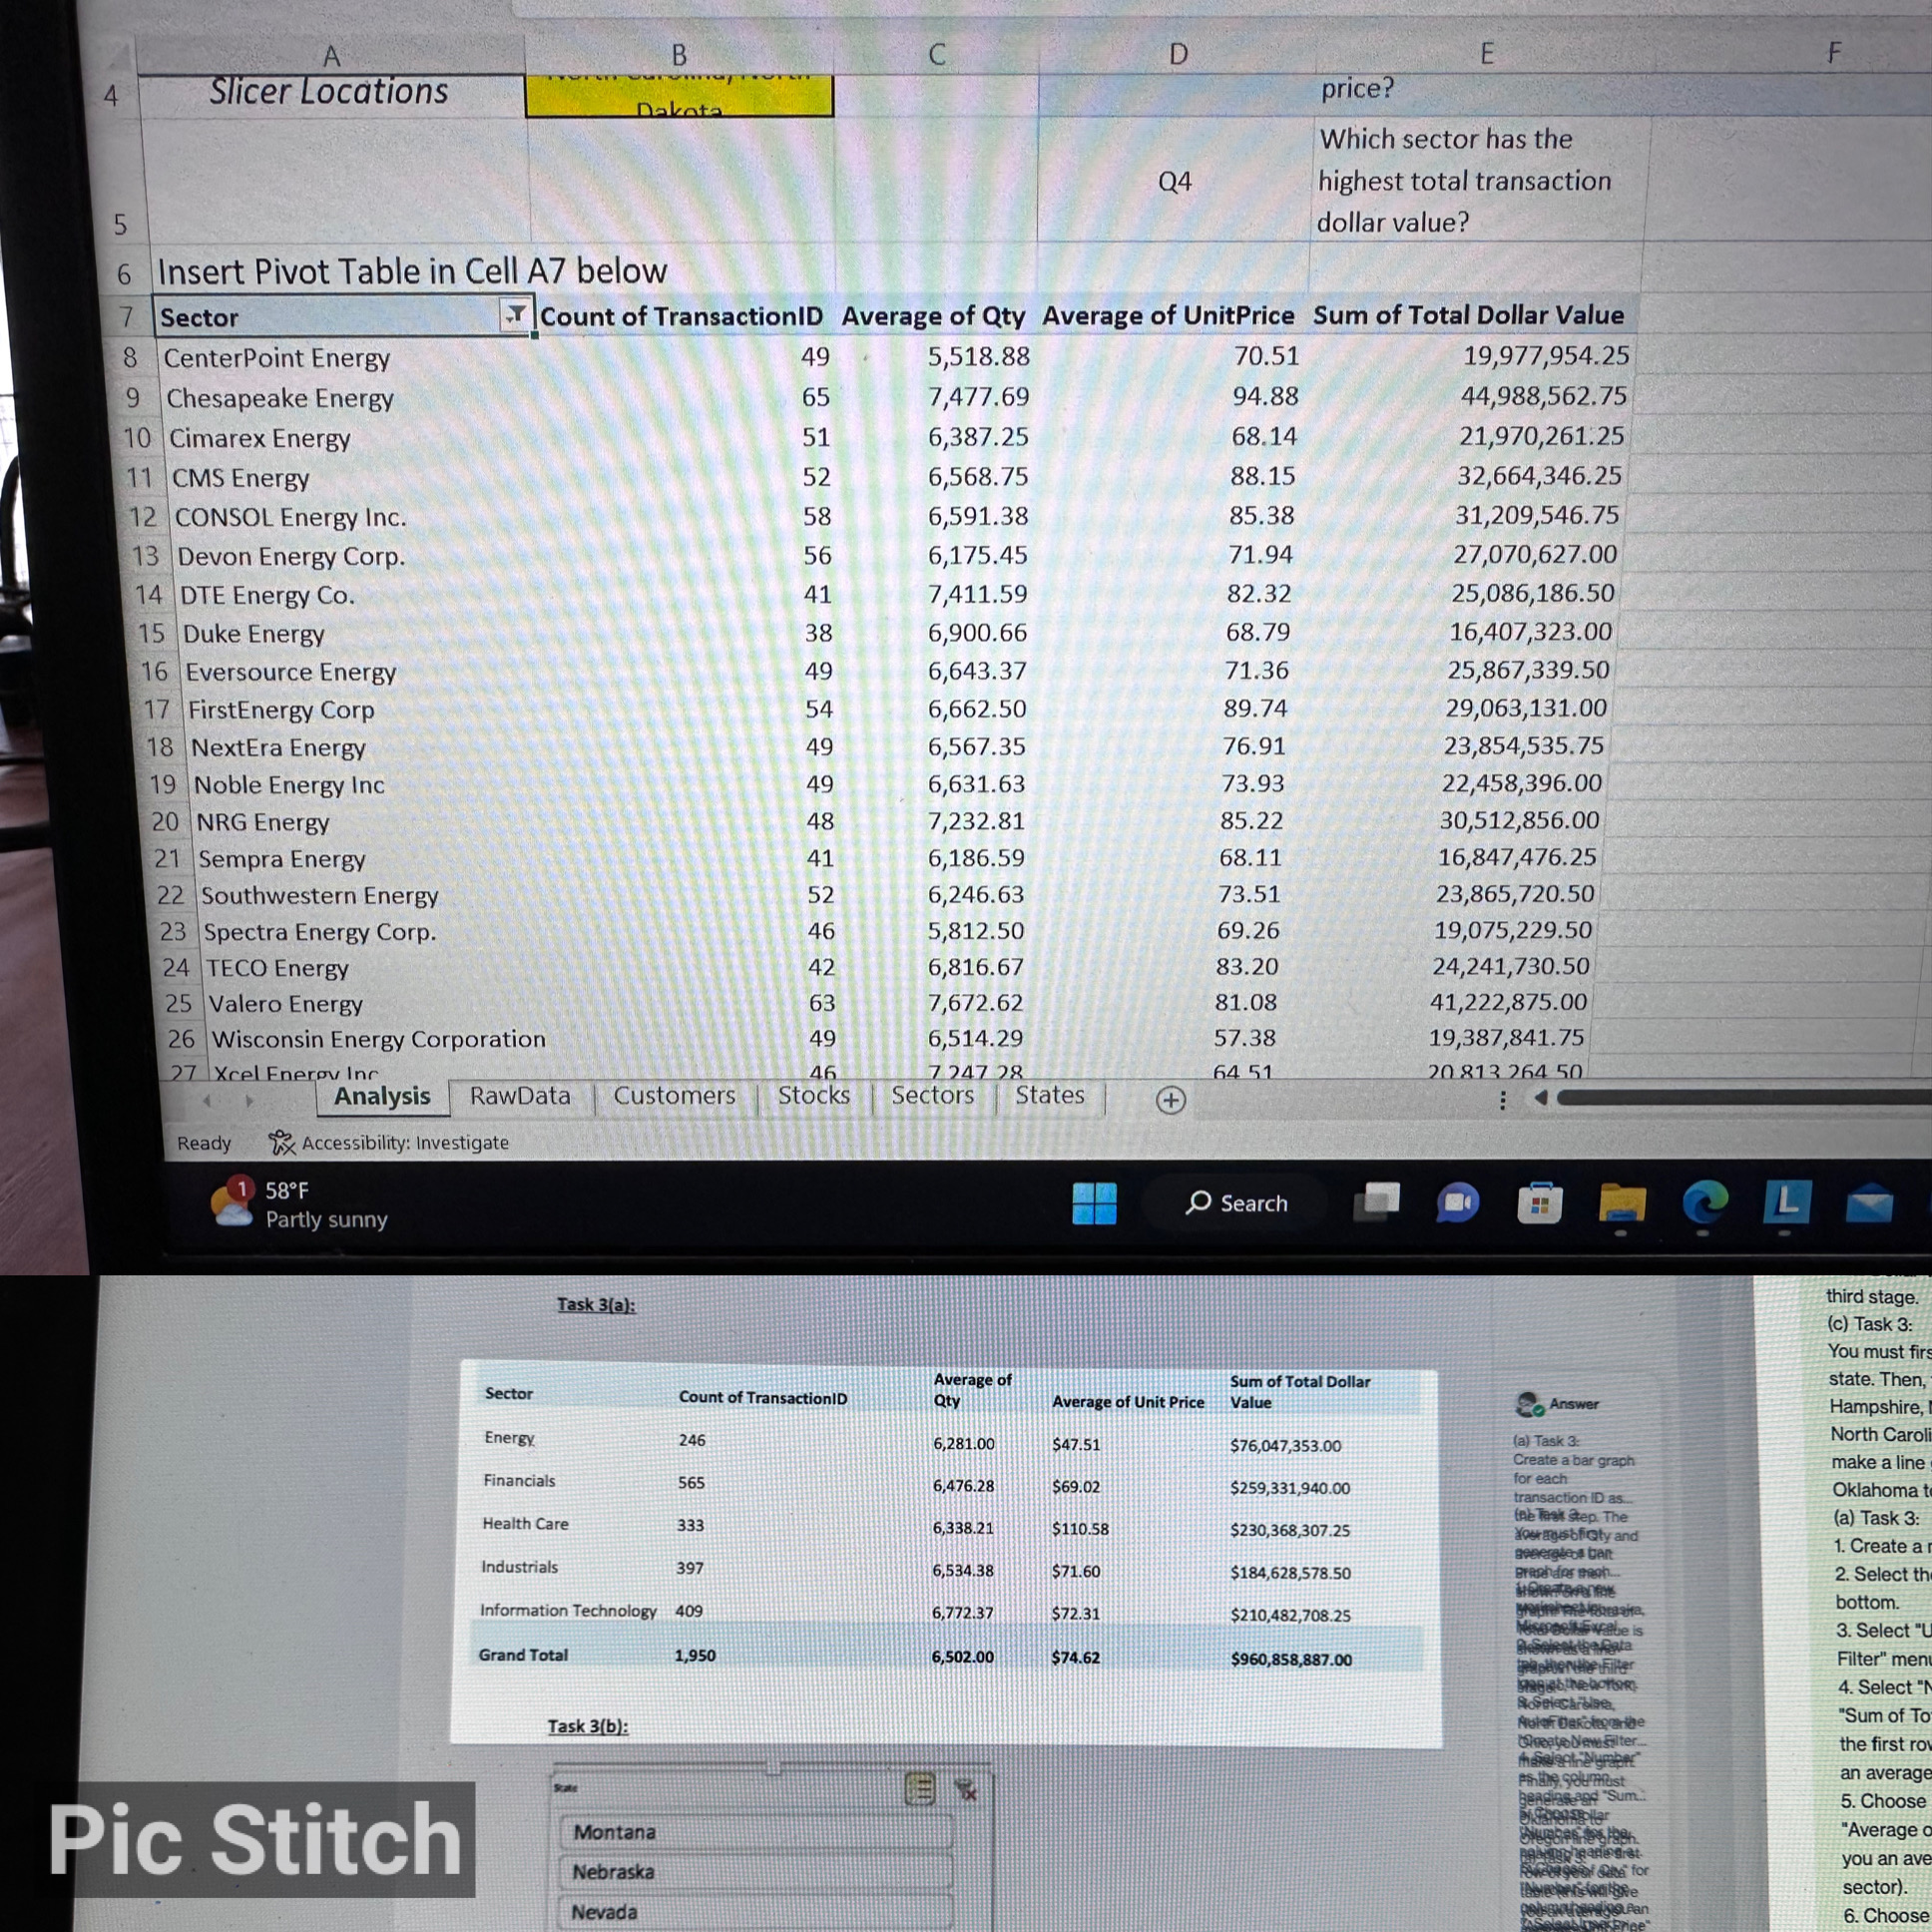
\fB C D E F 4 Slicer Locations price? Dakota Which sector has the Q4 highest total transaction 5 dollar value? 6 Insert Pivot Table in Cell A7 below Sector |Count of TransactionID Average of Qty Average of UnitPrice Sum of Total Dollar Value 8 CenterPoint Energy 49 5,518.88 70.51 19,977,954.25 9 Chesapeake Energy 65 7,477.69 94.88 44,988,562.75 10 Cimarex Energy 51 6,387.25 68.14 21,970,261.25 11 CMS Energy 52 6,568.75 88.15 32,664,346.25 12 CONSOL Energy Inc. 58 6,591.38 85.38 31,209,546.75 13 Devon Energy Corp. 56 6,175.45 71.94 27,070,627.00 14 DTE Energy Co. 41 7,411.59 82.32 25,086,186.50 15 Duke Energy 38 6,900.66 68.79 16,407,323.00 16 Eversource Energy 49 6,643.37 71.36 25,867,339.50 17 FirstEnergy Corp 54 6,662.50 89.74 29,063,131.00 18 NextEra Energy 49 6,567.35 76.91 23,854,535.75 19 Noble Energy Inc 49 6,631.63 73.93 22,458,396.00 20 NRG Energy 48 7,232.81 85.22 30,512,856.00 21 Sempra Energy 41 6,186.59 68.11 16,847,476.25 22 Southwestern Energy 52 6,246.63 73.51 23,865,720.50 23 Spectra Energy Corp. 46 5,812.50 69.26 19,075,229.50 24 TECO Energy 42 6,816.67 83.20 24,241,730.50 25 Valero Energy 63 7,672.62 81.08 41,222,875.00 26 Wisconsin Energy Corporation 49 6,514.29 57.38 19,387,841.75 27 Xcel Energy Inc 46 7 247 28 64 51 20 813 264 50 Analysis RawData Customers Stocks Sectors States (+ Ready Accessibility: Investigate 58.F Search L Partly sunny
Step by Step Solution
There are 3 Steps involved in it

Get step-by-step solutions from verified subject matter experts