

Question: On a single plot, show curves that show the relationship between the pressure generated by the pump as a function of flow rate of
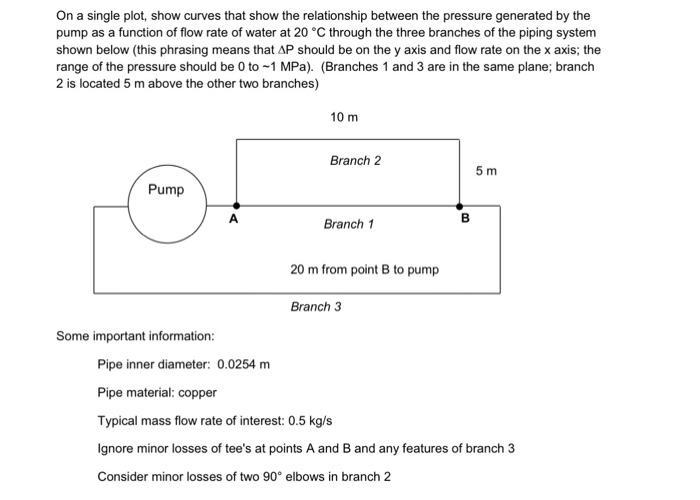
On a single plot, show curves that show the relationship between the pressure generated by the pump as a function of flow rate of water at 20 C through the three branches of the piping system shown below (this phrasing means that AP should be on the y axis and flow rate on the x axis; the range of the pressure should be 0 to -1 MPa). (Branches 1 and 3 are in the same plane; branch 2 is located 5 m above the other two branches) Pump Some important information: 10 m Branch 2 Branch 1 20 m from point B to pump Branch 3 B 5 m Pipe inner diameter: 0.0254 m Pipe material: copper Typical mass flow rate of interest: 0.5 kg/s Ignore minor losses of tee's at points A and B and any features of branch 3 Consider minor losses of two 90 elbows in branch 2
Step by Step Solution
3.48 Rating (151 Votes )
There are 3 Steps involved in it
Answer I Requirement i Total Pressure drop in Branches1 and 2 to be equal as they are in parallel Si... View full answer

Get step-by-step solutions from verified subject matter experts