

On May 15 of year 1 Javier purchased a building, including the land it was on,...
Fantastic news! We've Found the answer you've been seeking!
Question:
Transcribed Image Text:
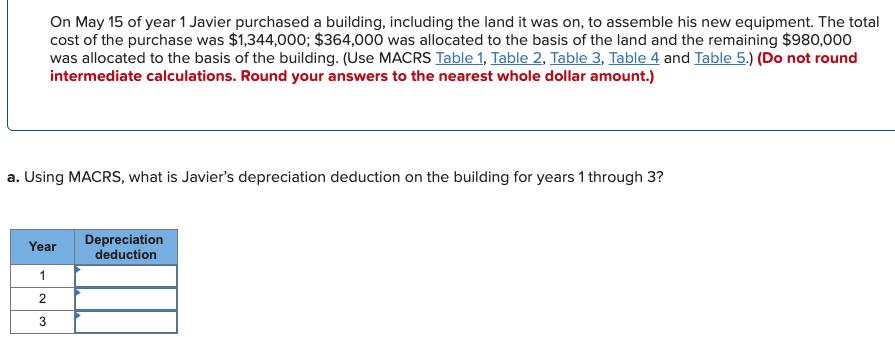
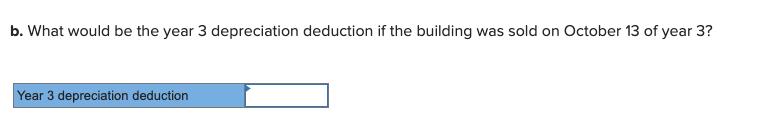
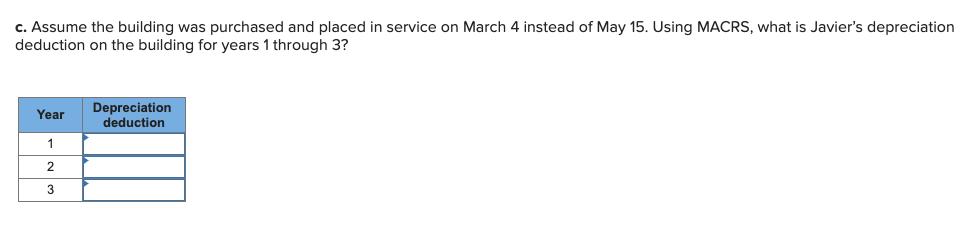
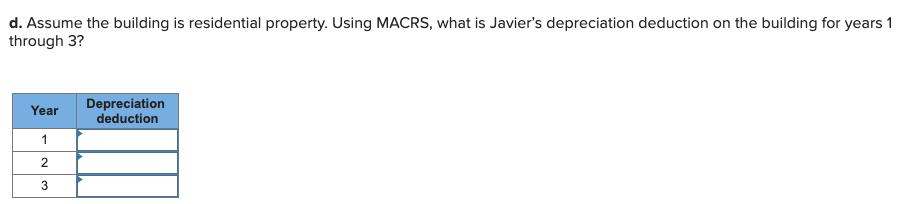
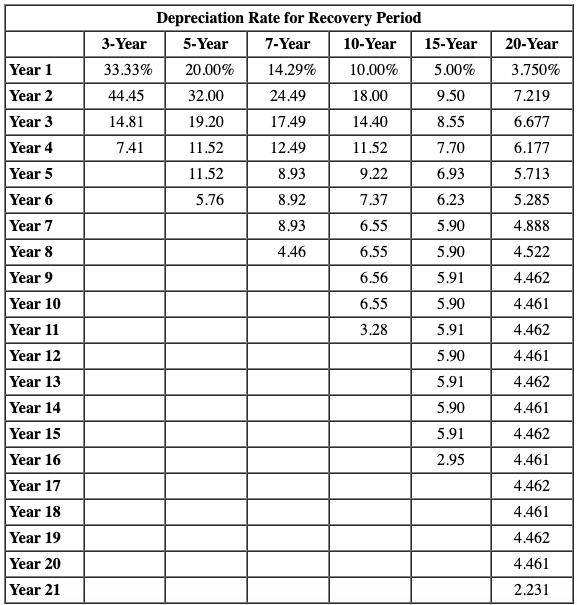
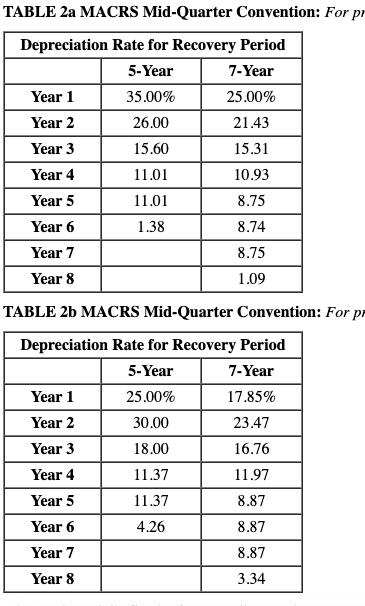
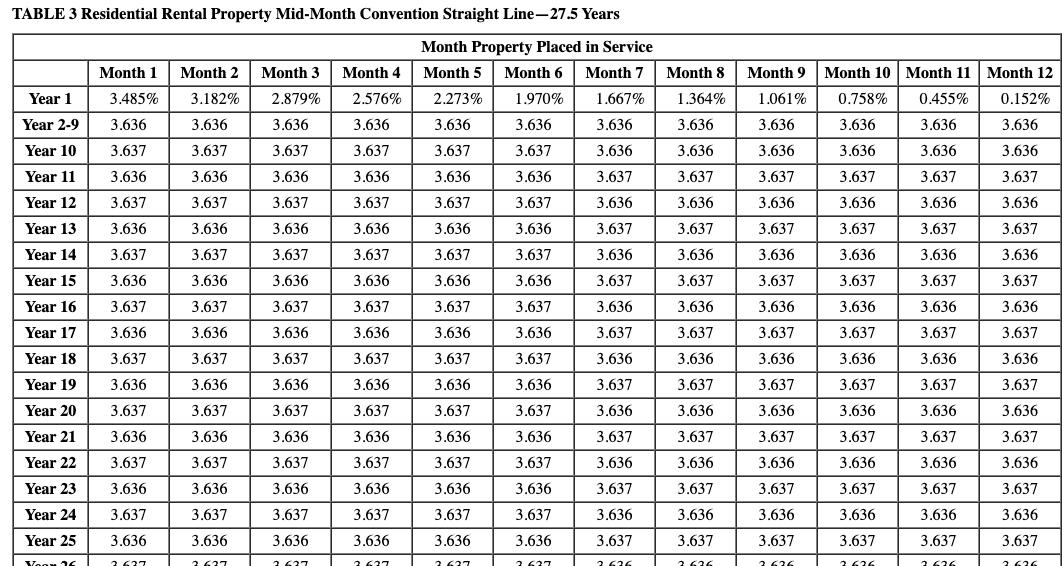
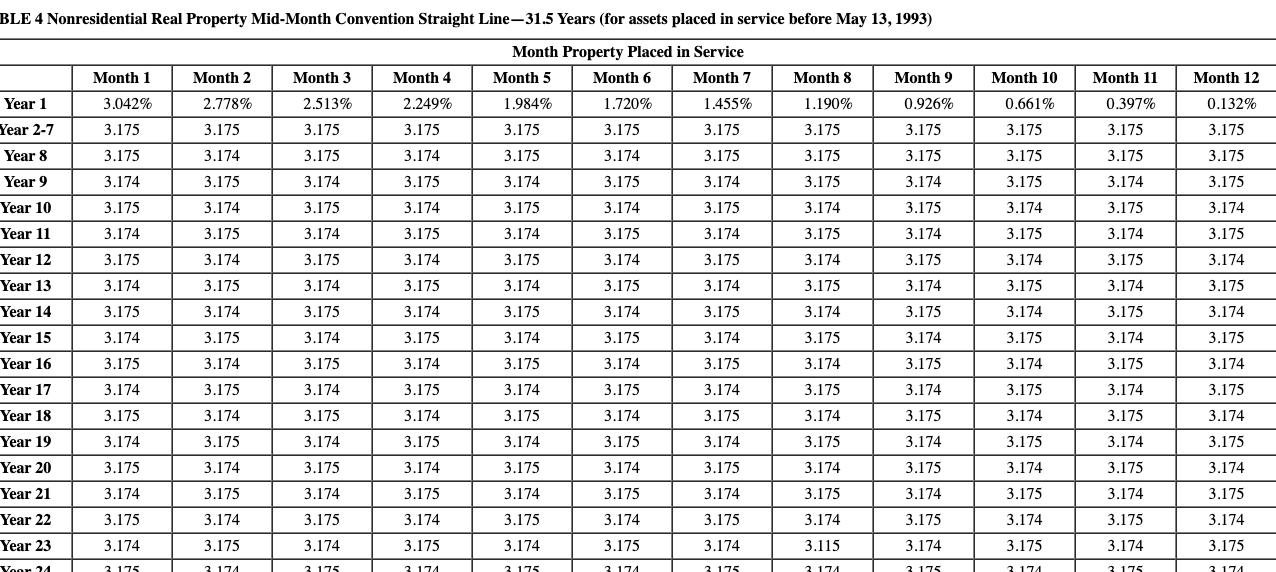
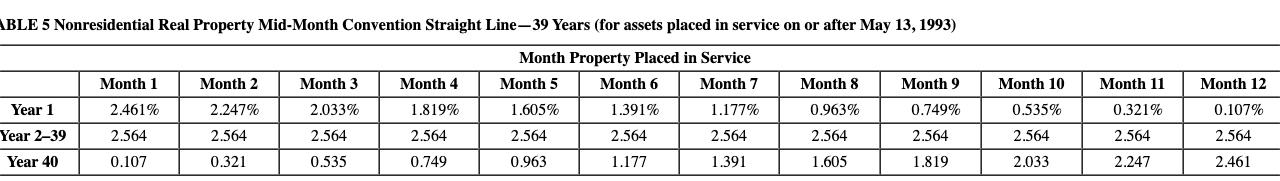
On May 15 of year 1 Javier purchased a building, including the land it was on, to assemble his new equipment. The total cost of the purchase was $1,344,000; $364,000 was allocated to the basis of the land and the remaining $980,000 was allocated to the basis of the building. (Use MACRS Table 1, Table 2, Table 3, Table 4 and Table 5.) (Do not round intermediate calculations. Round your answers to the nearest whole dollar amount.) a. Using MACRS, what is Javier's depreciation deduction on the building for years 1 through 3? Depreciation deduction Year 1 b. What would be the year 3 depreciation deduction if the building was sold on October 13 of year 3? Year 3 depreciation deduction c. Assume the building was purchased and placed in service on March 4 instead of May 15. Using MACRS, what is Javier's depreciation deduction on the building for years 1 through 3? Depreciation deduction Year 1 2 3. d. Assume the building is residential property. Using MACRS, what is Javier's depreciation deduction on the building for years 1 through 3? Depreciation deduction Year 1 2. e. What would be the depreciation for 2019, 2020, and 2021 if the property were nonresidential property purchased and placed in service May 15, 2002 (assume the same original basis)? Depreciation deduction Year 2019 2020 2021 Depreciation Rate for Recovery Period 3-Year 5-Year 7-Year 10-Year 15-Year 20-Year Year 1 Year 2 33.33% 20.00% 14.29% 10.00% 5.00% 3.750% 44.45 32.00 24.49 18.00 9.50 7.219 Year 3 Year 4 14.81 19.20 17.49 14.40 8.55 6.677 7.41 11.52 12.49 11.52 7.70 6.177 Year 5 11.52 8.93 9.22 6.93 5.713 Year 6 5.76 8.92 7.37 6.23 5.285 Year 7 Year 8 8.93 6.55 5.90 4.888 4.46 6.55 5.90 4.522 Year 9 6.56 5.91 4.462 Year 10 Year 11 Year 12 Year 13 6.55 5.90 4.461 3.28 5.91 4.462 5.90 4.461 5.91 4.462 Year 14 5.90 4.461 Year 15 Year 16 5.91 4.462 2.95 4.461 Year 17 4.462 Year 18 Year 19 Year 20 Year 21 4.461 4.462 4.461 2.231 TABLE 2a MACRS Mid-Quarter Convention: For pr Depreciation Rate for Recovery Period 5-Year 7-Year Year 1 35.00% 25.00% Year 2 26.00 21.43 Year 3 15.60 15.31 Year 4 11.01 10.93 Year 5 11.01 8.75 Year 6 1.38 8.74 Year 7 8.75 Year 8 1.09 TABLE 2b MACRS Mid-Quarter Convention: For pr Depreciation Rate for Recovery Period 5-Year 7-Year Year 1 25.00% 17.85% Year 2 30.00 23.47 Year 3 18.00 16.76 Year 4 11.37 11.97 Year 5 11.37 8.87 Year 6 4.26 8.87 Year 7 8.87 Year 8 3.34 TABLE 3 Residential Rental Property Mid-Month Convention Straight Line-27.5 Years Month Property Placed in Service Month 1 Month 2 Month 3 Month 4 Month 5 Month 6 Month 7 Month 8 Month 9 Month 10 Month 11 Month 12 Year 1 3.485% 3.182% 2.879% 2.576% 2.273% 1.970% 1.667% 1.364% 1.061% 0.758% 0.455% 0.152% Year 2-9 3.636 3.636 3.636 3.636 3.636 3.636 3.636 3.636 3.636 3.636 3.636 3.636 Year 10 3.637 3.637 3.637 3.637 3.637 3.637 3.636 3.636 3.636 3.636 3.636 3.636 Year 11 3.636 3.636 3.636 3.636 3.636 3.636 3.637 3.637 3.637 3.637 3.637 3.637 Year 12 3.637 3.637 3.637 3.637 3.637 3.637 3.636 3.636 3.636 3.636 3.636 3.636 Year 13 3.636 3.636 3.636 3.636 3.636 3.636 3.637 3.637 3.637 3.637 3.637 3.637 Year 14 3.637 3.637 3.637 3.637 3.637 3.637 3.636 3.636 3.636 3.636 3.636 3.636 Year 15 3.636 3.636 3.636 3.636 3.636 3.636 3.637 3.637 3.637 3.637 3.637 3.637 Year 16 3.637 3.637 3.637 3.637 3.637 3.637 3.636 3.636 3.636 3.636 3.636 3.636 Year 17 3.636 3.636 3.636 3.636 3.636 3.636 3.637 3.637 3.637 3.637 3.637 3.637 Year 18 3.637 3.637 3.637 3.637 3.637 3.637 3.636 3.636 3.636 3.636 3.636 3.636 Year 19 3.636 3.636 3.636 3.636 3.636 3.636 3.637 3.637 3.637 3,637 3.637 3.637 Year 20 3.637 3.637 3.637 3.637 3.637 3.637 3.636 3.636 3.636 3.636 3.636 3.636 Year 21 3.636 3.636 3.636 3.636 3.636 3.636 3.637 3.637 3.637 3.637 3.637 3.637 22 3.637 3.6 3.637 3.637 3.637 3.636 3.636 3.636 3.636 3.636 3.636 Year 23 3.636 3.636 3.636 3.636 3.636 3.636 3.637 3.637 3.637 3.637 3.637 3.637 Year 24 3.637 3.637 3.637 3.637 3.637 3.637 3.636 3.636 3.636 3.636 3.636 3.636 Year 25 3.636 3.636 3.636 3.636 3.636 3.636 3.637 3.637 3.637 3.637 3.637 3.637 Yoon 16 3 637 3 637 3 637 3 636 3 636 3 636 3 636 2627 3.637 3627 3636 3636 T TTT BLE 4 Nonresidential Real Property Mid-Month Convention Straight Line-31.5 Years (for assets placed in service before May 13, 1993) Month Property Placed in Service Month 1 Month 2 Month 3 Month 4 Month 5 Month 6 Month 7 Month 8 Month 9 Month 10 Month 11 Month 12 Year 1 3.042% 2.778% 2.513% 2.249% 1.984% 1.720% 1.455% 1.190% 0.926% 0.661% 0.397% 0.132% Year 2-7 3.175 3.175 3.175 3.175 3.175 3.175 3.175 3.175 3.175 3.175 3.175 3.175 Year 8 3.175 3.174 3.175 3.174 3.175 3.174 3.175 3.175 3.175 3.175 3.175 3.175 Year 9 3.174 3.175 3.174 3.175 3.174 3.175 3.174 3.175 3.174 3.175 3.174 3.175 Year 10 3.175 3.174 3.175 3.174 3.175 3.174 3.175 3.174 3.175 3.174 3.175 3.174 Year 11 3.174 3.175 3.174 3.175 3.174 3.175 3.174 3.175 3.174 3.175 3.174 3.175 Year 12 3.175 3.174 3.175 3.174 3.175 3.174 3.175 3.174 3.175 3.174 3.175 3.174 Year 13 3.174 3.175 3.174 3.175 3.174 3.175 3.174 3.175 3.174 3.175 3.174 3.175 Year 14 3.175 3.174 3.175 3.174 3.175 3.174 3.175 3.174 3.175 3.174 3.175 3.174 Year 15 3.174 3.175 3.174 3.175 3.174 3.175 3.174 3.175 3.174 3.175 3.174 3.175 Year 16 3.175 3.174 3.175 3.174 3.175 3.174 3.175 3.174 3.175 3.174 3.175 3.174 Year 17 3.174 3.175 3.174 3.175 3.174 3.175 3.174 3.175 3.174 3.175 3.174 3.175 Year 18 3.175 3.174 3.175 3.174 3.175 3.174 3.175 3.174 3.175 3.174 3.175 3.174 Year 19 3.174 3.175 3.174 3.175 3.174 3.175 3.174 3.175 3.174 3.175 3.174 3.175 Year 20 3.175 3.174 3.175 3.174 3.175 3.174 3.175 3.174 3.175 3.174 3.175 3.174 Year 21 3.174 3.175 3.174 3.175 3.174 3.175 3.174 3.175 3.174 3.175 3.174 3.175 Year 22 3.175 3.174 3.175 3.174 3.175 3.174 3.175 3.174 3.175 3.174 3.175 3.174 Year 23 3.174 3.175 3.174 3.175 3.174 3.175 3.174 3.115 3.174 3.175 3.174 3.175 Yoor 24 3 175 3 174 3 175 3 174 3 175 3 174 3. 175 3 174 3 175 174 3 175 3 174 ABLE 5 Nonresidential Real Property Mid-Month Convention Straight Line-39 Years (for assets placed in service on or after May 13, 1993) Month Property Placed in Service Month 1 Month 2 Month 3 Month 4 Month 5 Month 6 Month 7 Month 8 Month 9 Month 10 Month 11 Month 12 Year 1 2.461% 2.247% 2.033% 1.819% 1.605% 1.391% 1.177% 0.963% 0.749% 0.535% 0.321% 0.107% Year 2-39 2.564 2.564 2.564 2.564 2.564 2.564 2.564 2.564 2.564 2.564 2.564 2.564 Year 40 0.107 0,321 0.535 0.749 0.963 1.177 1.391 1.605 1.819 2.033 2.247 2.461 On May 15 of year 1 Javier purchased a building, including the land it was on, to assemble his new equipment. The total cost of the purchase was $1,344,000; $364,000 was allocated to the basis of the land and the remaining $980,000 was allocated to the basis of the building. (Use MACRS Table 1, Table 2, Table 3, Table 4 and Table 5.) (Do not round intermediate calculations. Round your answers to the nearest whole dollar amount.) a. Using MACRS, what is Javier's depreciation deduction on the building for years 1 through 3? Depreciation deduction Year 1 b. What would be the year 3 depreciation deduction if the building was sold on October 13 of year 3? Year 3 depreciation deduction c. Assume the building was purchased and placed in service on March 4 instead of May 15. Using MACRS, what is Javier's depreciation deduction on the building for years 1 through 3? Depreciation deduction Year 1 2 3. d. Assume the building is residential property. Using MACRS, what is Javier's depreciation deduction on the building for years 1 through 3? Depreciation deduction Year 1 2. e. What would be the depreciation for 2019, 2020, and 2021 if the property were nonresidential property purchased and placed in service May 15, 2002 (assume the same original basis)? Depreciation deduction Year 2019 2020 2021 Depreciation Rate for Recovery Period 3-Year 5-Year 7-Year 10-Year 15-Year 20-Year Year 1 Year 2 33.33% 20.00% 14.29% 10.00% 5.00% 3.750% 44.45 32.00 24.49 18.00 9.50 7.219 Year 3 Year 4 14.81 19.20 17.49 14.40 8.55 6.677 7.41 11.52 12.49 11.52 7.70 6.177 Year 5 11.52 8.93 9.22 6.93 5.713 Year 6 5.76 8.92 7.37 6.23 5.285 Year 7 Year 8 8.93 6.55 5.90 4.888 4.46 6.55 5.90 4.522 Year 9 6.56 5.91 4.462 Year 10 Year 11 Year 12 Year 13 6.55 5.90 4.461 3.28 5.91 4.462 5.90 4.461 5.91 4.462 Year 14 5.90 4.461 Year 15 Year 16 5.91 4.462 2.95 4.461 Year 17 4.462 Year 18 Year 19 Year 20 Year 21 4.461 4.462 4.461 2.231 TABLE 2a MACRS Mid-Quarter Convention: For pr Depreciation Rate for Recovery Period 5-Year 7-Year Year 1 35.00% 25.00% Year 2 26.00 21.43 Year 3 15.60 15.31 Year 4 11.01 10.93 Year 5 11.01 8.75 Year 6 1.38 8.74 Year 7 8.75 Year 8 1.09 TABLE 2b MACRS Mid-Quarter Convention: For pr Depreciation Rate for Recovery Period 5-Year 7-Year Year 1 25.00% 17.85% Year 2 30.00 23.47 Year 3 18.00 16.76 Year 4 11.37 11.97 Year 5 11.37 8.87 Year 6 4.26 8.87 Year 7 8.87 Year 8 3.34 TABLE 3 Residential Rental Property Mid-Month Convention Straight Line-27.5 Years Month Property Placed in Service Month 1 Month 2 Month 3 Month 4 Month 5 Month 6 Month 7 Month 8 Month 9 Month 10 Month 11 Month 12 Year 1 3.485% 3.182% 2.879% 2.576% 2.273% 1.970% 1.667% 1.364% 1.061% 0.758% 0.455% 0.152% Year 2-9 3.636 3.636 3.636 3.636 3.636 3.636 3.636 3.636 3.636 3.636 3.636 3.636 Year 10 3.637 3.637 3.637 3.637 3.637 3.637 3.636 3.636 3.636 3.636 3.636 3.636 Year 11 3.636 3.636 3.636 3.636 3.636 3.636 3.637 3.637 3.637 3.637 3.637 3.637 Year 12 3.637 3.637 3.637 3.637 3.637 3.637 3.636 3.636 3.636 3.636 3.636 3.636 Year 13 3.636 3.636 3.636 3.636 3.636 3.636 3.637 3.637 3.637 3.637 3.637 3.637 Year 14 3.637 3.637 3.637 3.637 3.637 3.637 3.636 3.636 3.636 3.636 3.636 3.636 Year 15 3.636 3.636 3.636 3.636 3.636 3.636 3.637 3.637 3.637 3.637 3.637 3.637 Year 16 3.637 3.637 3.637 3.637 3.637 3.637 3.636 3.636 3.636 3.636 3.636 3.636 Year 17 3.636 3.636 3.636 3.636 3.636 3.636 3.637 3.637 3.637 3.637 3.637 3.637 Year 18 3.637 3.637 3.637 3.637 3.637 3.637 3.636 3.636 3.636 3.636 3.636 3.636 Year 19 3.636 3.636 3.636 3.636 3.636 3.636 3.637 3.637 3.637 3,637 3.637 3.637 Year 20 3.637 3.637 3.637 3.637 3.637 3.637 3.636 3.636 3.636 3.636 3.636 3.636 Year 21 3.636 3.636 3.636 3.636 3.636 3.636 3.637 3.637 3.637 3.637 3.637 3.637 22 3.637 3.6 3.637 3.637 3.637 3.636 3.636 3.636 3.636 3.636 3.636 Year 23 3.636 3.636 3.636 3.636 3.636 3.636 3.637 3.637 3.637 3.637 3.637 3.637 Year 24 3.637 3.637 3.637 3.637 3.637 3.637 3.636 3.636 3.636 3.636 3.636 3.636 Year 25 3.636 3.636 3.636 3.636 3.636 3.636 3.637 3.637 3.637 3.637 3.637 3.637 Yoon 16 3 637 3 637 3 637 3 636 3 636 3 636 3 636 2627 3.637 3627 3636 3636 T TTT BLE 4 Nonresidential Real Property Mid-Month Convention Straight Line-31.5 Years (for assets placed in service before May 13, 1993) Month Property Placed in Service Month 1 Month 2 Month 3 Month 4 Month 5 Month 6 Month 7 Month 8 Month 9 Month 10 Month 11 Month 12 Year 1 3.042% 2.778% 2.513% 2.249% 1.984% 1.720% 1.455% 1.190% 0.926% 0.661% 0.397% 0.132% Year 2-7 3.175 3.175 3.175 3.175 3.175 3.175 3.175 3.175 3.175 3.175 3.175 3.175 Year 8 3.175 3.174 3.175 3.174 3.175 3.174 3.175 3.175 3.175 3.175 3.175 3.175 Year 9 3.174 3.175 3.174 3.175 3.174 3.175 3.174 3.175 3.174 3.175 3.174 3.175 Year 10 3.175 3.174 3.175 3.174 3.175 3.174 3.175 3.174 3.175 3.174 3.175 3.174 Year 11 3.174 3.175 3.174 3.175 3.174 3.175 3.174 3.175 3.174 3.175 3.174 3.175 Year 12 3.175 3.174 3.175 3.174 3.175 3.174 3.175 3.174 3.175 3.174 3.175 3.174 Year 13 3.174 3.175 3.174 3.175 3.174 3.175 3.174 3.175 3.174 3.175 3.174 3.175 Year 14 3.175 3.174 3.175 3.174 3.175 3.174 3.175 3.174 3.175 3.174 3.175 3.174 Year 15 3.174 3.175 3.174 3.175 3.174 3.175 3.174 3.175 3.174 3.175 3.174 3.175 Year 16 3.175 3.174 3.175 3.174 3.175 3.174 3.175 3.174 3.175 3.174 3.175 3.174 Year 17 3.174 3.175 3.174 3.175 3.174 3.175 3.174 3.175 3.174 3.175 3.174 3.175 Year 18 3.175 3.174 3.175 3.174 3.175 3.174 3.175 3.174 3.175 3.174 3.175 3.174 Year 19 3.174 3.175 3.174 3.175 3.174 3.175 3.174 3.175 3.174 3.175 3.174 3.175 Year 20 3.175 3.174 3.175 3.174 3.175 3.174 3.175 3.174 3.175 3.174 3.175 3.174 Year 21 3.174 3.175 3.174 3.175 3.174 3.175 3.174 3.175 3.174 3.175 3.174 3.175 Year 22 3.175 3.174 3.175 3.174 3.175 3.174 3.175 3.174 3.175 3.174 3.175 3.174 Year 23 3.174 3.175 3.174 3.175 3.174 3.175 3.174 3.115 3.174 3.175 3.174 3.175 Yoor 24 3 175 3 174 3 175 3 174 3 175 3 174 3. 175 3 174 3 175 174 3 175 3 174 ABLE 5 Nonresidential Real Property Mid-Month Convention Straight Line-39 Years (for assets placed in service on or after May 13, 1993) Month Property Placed in Service Month 1 Month 2 Month 3 Month 4 Month 5 Month 6 Month 7 Month 8 Month 9 Month 10 Month 11 Month 12 Year 1 2.461% 2.247% 2.033% 1.819% 1.605% 1.391% 1.177% 0.963% 0.749% 0.535% 0.321% 0.107% Year 2-39 2.564 2.564 2.564 2.564 2.564 2.564 2.564 2.564 2.564 2.564 2.564 2.564 Year 40 0.107 0,321 0.535 0.749 0.963 1.177 1.391 1.605 1.819 2.033 2.247 2.461 On May 15 of year 1 Javier purchased a building, including the land it was on, to assemble his new equipment. The total cost of the purchase was $1,344,000; $364,000 was allocated to the basis of the land and the remaining $980,000 was allocated to the basis of the building. (Use MACRS Table 1, Table 2, Table 3, Table 4 and Table 5.) (Do not round intermediate calculations. Round your answers to the nearest whole dollar amount.) a. Using MACRS, what is Javier's depreciation deduction on the building for years 1 through 3? Depreciation deduction Year 1 b. What would be the year 3 depreciation deduction if the building was sold on October 13 of year 3? Year 3 depreciation deduction c. Assume the building was purchased and placed in service on March 4 instead of May 15. Using MACRS, what is Javier's depreciation deduction on the building for years 1 through 3? Depreciation deduction Year 1 2 3. d. Assume the building is residential property. Using MACRS, what is Javier's depreciation deduction on the building for years 1 through 3? Depreciation deduction Year 1 2. e. What would be the depreciation for 2019, 2020, and 2021 if the property were nonresidential property purchased and placed in service May 15, 2002 (assume the same original basis)? Depreciation deduction Year 2019 2020 2021 Depreciation Rate for Recovery Period 3-Year 5-Year 7-Year 10-Year 15-Year 20-Year Year 1 Year 2 33.33% 20.00% 14.29% 10.00% 5.00% 3.750% 44.45 32.00 24.49 18.00 9.50 7.219 Year 3 Year 4 14.81 19.20 17.49 14.40 8.55 6.677 7.41 11.52 12.49 11.52 7.70 6.177 Year 5 11.52 8.93 9.22 6.93 5.713 Year 6 5.76 8.92 7.37 6.23 5.285 Year 7 Year 8 8.93 6.55 5.90 4.888 4.46 6.55 5.90 4.522 Year 9 6.56 5.91 4.462 Year 10 Year 11 Year 12 Year 13 6.55 5.90 4.461 3.28 5.91 4.462 5.90 4.461 5.91 4.462 Year 14 5.90 4.461 Year 15 Year 16 5.91 4.462 2.95 4.461 Year 17 4.462 Year 18 Year 19 Year 20 Year 21 4.461 4.462 4.461 2.231 TABLE 2a MACRS Mid-Quarter Convention: For pr Depreciation Rate for Recovery Period 5-Year 7-Year Year 1 35.00% 25.00% Year 2 26.00 21.43 Year 3 15.60 15.31 Year 4 11.01 10.93 Year 5 11.01 8.75 Year 6 1.38 8.74 Year 7 8.75 Year 8 1.09 TABLE 2b MACRS Mid-Quarter Convention: For pr Depreciation Rate for Recovery Period 5-Year 7-Year Year 1 25.00% 17.85% Year 2 30.00 23.47 Year 3 18.00 16.76 Year 4 11.37 11.97 Year 5 11.37 8.87 Year 6 4.26 8.87 Year 7 8.87 Year 8 3.34 TABLE 3 Residential Rental Property Mid-Month Convention Straight Line-27.5 Years Month Property Placed in Service Month 1 Month 2 Month 3 Month 4 Month 5 Month 6 Month 7 Month 8 Month 9 Month 10 Month 11 Month 12 Year 1 3.485% 3.182% 2.879% 2.576% 2.273% 1.970% 1.667% 1.364% 1.061% 0.758% 0.455% 0.152% Year 2-9 3.636 3.636 3.636 3.636 3.636 3.636 3.636 3.636 3.636 3.636 3.636 3.636 Year 10 3.637 3.637 3.637 3.637 3.637 3.637 3.636 3.636 3.636 3.636 3.636 3.636 Year 11 3.636 3.636 3.636 3.636 3.636 3.636 3.637 3.637 3.637 3.637 3.637 3.637 Year 12 3.637 3.637 3.637 3.637 3.637 3.637 3.636 3.636 3.636 3.636 3.636 3.636 Year 13 3.636 3.636 3.636 3.636 3.636 3.636 3.637 3.637 3.637 3.637 3.637 3.637 Year 14 3.637 3.637 3.637 3.637 3.637 3.637 3.636 3.636 3.636 3.636 3.636 3.636 Year 15 3.636 3.636 3.636 3.636 3.636 3.636 3.637 3.637 3.637 3.637 3.637 3.637 Year 16 3.637 3.637 3.637 3.637 3.637 3.637 3.636 3.636 3.636 3.636 3.636 3.636 Year 17 3.636 3.636 3.636 3.636 3.636 3.636 3.637 3.637 3.637 3.637 3.637 3.637 Year 18 3.637 3.637 3.637 3.637 3.637 3.637 3.636 3.636 3.636 3.636 3.636 3.636 Year 19 3.636 3.636 3.636 3.636 3.636 3.636 3.637 3.637 3.637 3,637 3.637 3.637 Year 20 3.637 3.637 3.637 3.637 3.637 3.637 3.636 3.636 3.636 3.636 3.636 3.636 Year 21 3.636 3.636 3.636 3.636 3.636 3.636 3.637 3.637 3.637 3.637 3.637 3.637 22 3.637 3.6 3.637 3.637 3.637 3.636 3.636 3.636 3.636 3.636 3.636 Year 23 3.636 3.636 3.636 3.636 3.636 3.636 3.637 3.637 3.637 3.637 3.637 3.637 Year 24 3.637 3.637 3.637 3.637 3.637 3.637 3.636 3.636 3.636 3.636 3.636 3.636 Year 25 3.636 3.636 3.636 3.636 3.636 3.636 3.637 3.637 3.637 3.637 3.637 3.637 Yoon 16 3 637 3 637 3 637 3 636 3 636 3 636 3 636 2627 3.637 3627 3636 3636 T TTT BLE 4 Nonresidential Real Property Mid-Month Convention Straight Line-31.5 Years (for assets placed in service before May 13, 1993) Month Property Placed in Service Month 1 Month 2 Month 3 Month 4 Month 5 Month 6 Month 7 Month 8 Month 9 Month 10 Month 11 Month 12 Year 1 3.042% 2.778% 2.513% 2.249% 1.984% 1.720% 1.455% 1.190% 0.926% 0.661% 0.397% 0.132% Year 2-7 3.175 3.175 3.175 3.175 3.175 3.175 3.175 3.175 3.175 3.175 3.175 3.175 Year 8 3.175 3.174 3.175 3.174 3.175 3.174 3.175 3.175 3.175 3.175 3.175 3.175 Year 9 3.174 3.175 3.174 3.175 3.174 3.175 3.174 3.175 3.174 3.175 3.174 3.175 Year 10 3.175 3.174 3.175 3.174 3.175 3.174 3.175 3.174 3.175 3.174 3.175 3.174 Year 11 3.174 3.175 3.174 3.175 3.174 3.175 3.174 3.175 3.174 3.175 3.174 3.175 Year 12 3.175 3.174 3.175 3.174 3.175 3.174 3.175 3.174 3.175 3.174 3.175 3.174 Year 13 3.174 3.175 3.174 3.175 3.174 3.175 3.174 3.175 3.174 3.175 3.174 3.175 Year 14 3.175 3.174 3.175 3.174 3.175 3.174 3.175 3.174 3.175 3.174 3.175 3.174 Year 15 3.174 3.175 3.174 3.175 3.174 3.175 3.174 3.175 3.174 3.175 3.174 3.175 Year 16 3.175 3.174 3.175 3.174 3.175 3.174 3.175 3.174 3.175 3.174 3.175 3.174 Year 17 3.174 3.175 3.174 3.175 3.174 3.175 3.174 3.175 3.174 3.175 3.174 3.175 Year 18 3.175 3.174 3.175 3.174 3.175 3.174 3.175 3.174 3.175 3.174 3.175 3.174 Year 19 3.174 3.175 3.174 3.175 3.174 3.175 3.174 3.175 3.174 3.175 3.174 3.175 Year 20 3.175 3.174 3.175 3.174 3.175 3.174 3.175 3.174 3.175 3.174 3.175 3.174 Year 21 3.174 3.175 3.174 3.175 3.174 3.175 3.174 3.175 3.174 3.175 3.174 3.175 Year 22 3.175 3.174 3.175 3.174 3.175 3.174 3.175 3.174 3.175 3.174 3.175 3.174 Year 23 3.174 3.175 3.174 3.175 3.174 3.175 3.174 3.115 3.174 3.175 3.174 3.175 Yoor 24 3 175 3 174 3 175 3 174 3 175 3 174 3. 175 3 174 3 175 174 3 175 3 174 ABLE 5 Nonresidential Real Property Mid-Month Convention Straight Line-39 Years (for assets placed in service on or after May 13, 1993) Month Property Placed in Service Month 1 Month 2 Month 3 Month 4 Month 5 Month 6 Month 7 Month 8 Month 9 Month 10 Month 11 Month 12 Year 1 2.461% 2.247% 2.033% 1.819% 1.605% 1.391% 1.177% 0.963% 0.749% 0.535% 0.321% 0.107% Year 2-39 2.564 2.564 2.564 2.564 2.564 2.564 2.564 2.564 2.564 2.564 2.564 2.564 Year 40 0.107 0,321 0.535 0.749 0.963 1.177 1.391 1.605 1.819 2.033 2.247 2.461 On May 15 of year 1 Javier purchased a building, including the land it was on, to assemble his new equipment. The total cost of the purchase was $1,344,000; $364,000 was allocated to the basis of the land and the remaining $980,000 was allocated to the basis of the building. (Use MACRS Table 1, Table 2, Table 3, Table 4 and Table 5.) (Do not round intermediate calculations. Round your answers to the nearest whole dollar amount.) a. Using MACRS, what is Javier's depreciation deduction on the building for years 1 through 3? Depreciation deduction Year 1 b. What would be the year 3 depreciation deduction if the building was sold on October 13 of year 3? Year 3 depreciation deduction c. Assume the building was purchased and placed in service on March 4 instead of May 15. Using MACRS, what is Javier's depreciation deduction on the building for years 1 through 3? Depreciation deduction Year 1 2 3. d. Assume the building is residential property. Using MACRS, what is Javier's depreciation deduction on the building for years 1 through 3? Depreciation deduction Year 1 2. e. What would be the depreciation for 2019, 2020, and 2021 if the property were nonresidential property purchased and placed in service May 15, 2002 (assume the same original basis)? Depreciation deduction Year 2019 2020 2021 Depreciation Rate for Recovery Period 3-Year 5-Year 7-Year 10-Year 15-Year 20-Year Year 1 Year 2 33.33% 20.00% 14.29% 10.00% 5.00% 3.750% 44.45 32.00 24.49 18.00 9.50 7.219 Year 3 Year 4 14.81 19.20 17.49 14.40 8.55 6.677 7.41 11.52 12.49 11.52 7.70 6.177 Year 5 11.52 8.93 9.22 6.93 5.713 Year 6 5.76 8.92 7.37 6.23 5.285 Year 7 Year 8 8.93 6.55 5.90 4.888 4.46 6.55 5.90 4.522 Year 9 6.56 5.91 4.462 Year 10 Year 11 Year 12 Year 13 6.55 5.90 4.461 3.28 5.91 4.462 5.90 4.461 5.91 4.462 Year 14 5.90 4.461 Year 15 Year 16 5.91 4.462 2.95 4.461 Year 17 4.462 Year 18 Year 19 Year 20 Year 21 4.461 4.462 4.461 2.231 TABLE 2a MACRS Mid-Quarter Convention: For pr Depreciation Rate for Recovery Period 5-Year 7-Year Year 1 35.00% 25.00% Year 2 26.00 21.43 Year 3 15.60 15.31 Year 4 11.01 10.93 Year 5 11.01 8.75 Year 6 1.38 8.74 Year 7 8.75 Year 8 1.09 TABLE 2b MACRS Mid-Quarter Convention: For pr Depreciation Rate for Recovery Period 5-Year 7-Year Year 1 25.00% 17.85% Year 2 30.00 23.47 Year 3 18.00 16.76 Year 4 11.37 11.97 Year 5 11.37 8.87 Year 6 4.26 8.87 Year 7 8.87 Year 8 3.34 TABLE 3 Residential Rental Property Mid-Month Convention Straight Line-27.5 Years Month Property Placed in Service Month 1 Month 2 Month 3 Month 4 Month 5 Month 6 Month 7 Month 8 Month 9 Month 10 Month 11 Month 12 Year 1 3.485% 3.182% 2.879% 2.576% 2.273% 1.970% 1.667% 1.364% 1.061% 0.758% 0.455% 0.152% Year 2-9 3.636 3.636 3.636 3.636 3.636 3.636 3.636 3.636 3.636 3.636 3.636 3.636 Year 10 3.637 3.637 3.637 3.637 3.637 3.637 3.636 3.636 3.636 3.636 3.636 3.636 Year 11 3.636 3.636 3.636 3.636 3.636 3.636 3.637 3.637 3.637 3.637 3.637 3.637 Year 12 3.637 3.637 3.637 3.637 3.637 3.637 3.636 3.636 3.636 3.636 3.636 3.636 Year 13 3.636 3.636 3.636 3.636 3.636 3.636 3.637 3.637 3.637 3.637 3.637 3.637 Year 14 3.637 3.637 3.637 3.637 3.637 3.637 3.636 3.636 3.636 3.636 3.636 3.636 Year 15 3.636 3.636 3.636 3.636 3.636 3.636 3.637 3.637 3.637 3.637 3.637 3.637 Year 16 3.637 3.637 3.637 3.637 3.637 3.637 3.636 3.636 3.636 3.636 3.636 3.636 Year 17 3.636 3.636 3.636 3.636 3.636 3.636 3.637 3.637 3.637 3.637 3.637 3.637 Year 18 3.637 3.637 3.637 3.637 3.637 3.637 3.636 3.636 3.636 3.636 3.636 3.636 Year 19 3.636 3.636 3.636 3.636 3.636 3.636 3.637 3.637 3.637 3,637 3.637 3.637 Year 20 3.637 3.637 3.637 3.637 3.637 3.637 3.636 3.636 3.636 3.636 3.636 3.636 Year 21 3.636 3.636 3.636 3.636 3.636 3.636 3.637 3.637 3.637 3.637 3.637 3.637 22 3.637 3.6 3.637 3.637 3.637 3.636 3.636 3.636 3.636 3.636 3.636 Year 23 3.636 3.636 3.636 3.636 3.636 3.636 3.637 3.637 3.637 3.637 3.637 3.637 Year 24 3.637 3.637 3.637 3.637 3.637 3.637 3.636 3.636 3.636 3.636 3.636 3.636 Year 25 3.636 3.636 3.636 3.636 3.636 3.636 3.637 3.637 3.637 3.637 3.637 3.637 Yoon 16 3 637 3 637 3 637 3 636 3 636 3 636 3 636 2627 3.637 3627 3636 3636 T TTT BLE 4 Nonresidential Real Property Mid-Month Convention Straight Line-31.5 Years (for assets placed in service before May 13, 1993) Month Property Placed in Service Month 1 Month 2 Month 3 Month 4 Month 5 Month 6 Month 7 Month 8 Month 9 Month 10 Month 11 Month 12 Year 1 3.042% 2.778% 2.513% 2.249% 1.984% 1.720% 1.455% 1.190% 0.926% 0.661% 0.397% 0.132% Year 2-7 3.175 3.175 3.175 3.175 3.175 3.175 3.175 3.175 3.175 3.175 3.175 3.175 Year 8 3.175 3.174 3.175 3.174 3.175 3.174 3.175 3.175 3.175 3.175 3.175 3.175 Year 9 3.174 3.175 3.174 3.175 3.174 3.175 3.174 3.175 3.174 3.175 3.174 3.175 Year 10 3.175 3.174 3.175 3.174 3.175 3.174 3.175 3.174 3.175 3.174 3.175 3.174 Year 11 3.174 3.175 3.174 3.175 3.174 3.175 3.174 3.175 3.174 3.175 3.174 3.175 Year 12 3.175 3.174 3.175 3.174 3.175 3.174 3.175 3.174 3.175 3.174 3.175 3.174 Year 13 3.174 3.175 3.174 3.175 3.174 3.175 3.174 3.175 3.174 3.175 3.174 3.175 Year 14 3.175 3.174 3.175 3.174 3.175 3.174 3.175 3.174 3.175 3.174 3.175 3.174 Year 15 3.174 3.175 3.174 3.175 3.174 3.175 3.174 3.175 3.174 3.175 3.174 3.175 Year 16 3.175 3.174 3.175 3.174 3.175 3.174 3.175 3.174 3.175 3.174 3.175 3.174 Year 17 3.174 3.175 3.174 3.175 3.174 3.175 3.174 3.175 3.174 3.175 3.174 3.175 Year 18 3.175 3.174 3.175 3.174 3.175 3.174 3.175 3.174 3.175 3.174 3.175 3.174 Year 19 3.174 3.175 3.174 3.175 3.174 3.175 3.174 3.175 3.174 3.175 3.174 3.175 Year 20 3.175 3.174 3.175 3.174 3.175 3.174 3.175 3.174 3.175 3.174 3.175 3.174 Year 21 3.174 3.175 3.174 3.175 3.174 3.175 3.174 3.175 3.174 3.175 3.174 3.175 Year 22 3.175 3.174 3.175 3.174 3.175 3.174 3.175 3.174 3.175 3.174 3.175 3.174 Year 23 3.174 3.175 3.174 3.175 3.174 3.175 3.174 3.115 3.174 3.175 3.174 3.175 Yoor 24 3 175 3 174 3 175 3 174 3 175 3 174 3. 175 3 174 3 175 174 3 175 3 174 ABLE 5 Nonresidential Real Property Mid-Month Convention Straight Line-39 Years (for assets placed in service on or after May 13, 1993) Month Property Placed in Service Month 1 Month 2 Month 3 Month 4 Month 5 Month 6 Month 7 Month 8 Month 9 Month 10 Month 11 Month 12 Year 1 2.461% 2.247% 2.033% 1.819% 1.605% 1.391% 1.177% 0.963% 0.749% 0.535% 0.321% 0.107% Year 2-39 2.564 2.564 2.564 2.564 2.564 2.564 2.564 2.564 2.564 2.564 2.564 2.564 Year 40 0.107 0,321 0.535 0.749 0.963 1.177 1.391 1.605 1.819 2.033 2.247 2.461
Expert Answer:
Answer rating: 100% (QA)
a Year Method Recovery period Date of purchase Cost Percentage Depreciati... View the full answer

Related Book For 

Essentials of Federal Taxation 2019
ISBN: 9781260190045
10th edition
Authors: Brian Spilker, Benjamin Ayers, John Robinson, Edmund Outslay, Ronald Worsham, John Barrick, Connie Weaver
Posted Date:
Students also viewed these accounting questions
-
On November 10 of year 1 Javier purchased a building, including the land it was on, to assemble his new equipment.The total cost of the purchase was $1,200,000; $300,000 was allocated to the basis of...
-
On November 10 of year 1 Javier purchased a building, including the land it was on, to assemble his new equipment. The total cost of the purchase was $1,200,000; $300,000 was allocated to the basis...
-
On November 10 of year 1 Javier purchased a building, including the land it was on, to assemble his new equipment. The total cost of the purchase was $1,200,000; $300,000 was allocated to the basis...
-
Find an equation in cylindrical coordinates for the equation given in rectangular coordinates. y = x
-
How many significant figures are in each of the following numbers? a) 4.01 b) 4.010 c) 4 d) 2.00001 e) 0.00001 f) 2.1 - 1.10042 g) 7.01 3.1415
-
A milling operation is performed on a NC machining center. Total travel distance = 300 mm in a direction parallel to one of the axes of the worktable. Cutting speed = 1.25 m/s and chip load = 0.05...
-
Architecture is defined from two perspectives: the product itself and the development of the product. Compare the two definitions.
-
Consider flow in a circular tube within the test section length (between 1 and 2) a constant heat flux q" s is maintained. (a) For the following two cases, sketch the surface temperature Ts(x) and...
-
Baron Von's Munch House offers an equal number of soups and salads, along with 7 types of sandwiches. He advertises 253 possible pairings of his You-Pick-2 special (where customers pick any two...
-
On April 1, 2010, Jose Guadalupe established an interior decorating business, Lodge Designs. During the month, Jose completed the following transactions related to the business: Apr. 1. Jose...
-
Lithium Flouride, LiF, has the same crystal structure as NaCl and therefore has essentially the same Madelung constant ?. Its ionic cohesive energy is -10.5 eV and the value of n in the equation is...
-
Given the input image, and convolutional and max pooling operations, draw the outputs in two dashed boxes. 12 1201 1 1 0 0 0 1 1 1 0 1 0 2 1 1 2 0 2 2 1 202 20 0 1 1 2 10 3 by 3 convolutional filter...
-
Draw a rough picture of the window produced by this code public class Main extends Application { @Override public void start (Stage primaryStage) { HBox data= new HBox(10); Label name LBL = new...
-
Determine the forces acting on the ground and the torque, T12, to maintain static equilibrium for the four-bar linkage shown in the figure below (a) (b) De 3 A B 2 C 4 P 210 T12 04 B 3 RAO2 RDO4 = 7...
-
Consider a 2- ply lamination with all plies at 45 degrees and both layers have the same hardness Q as below Let's assume you have the matrix: [ Q ] = [130 2.5 2.5 10 0 ] 0 0 3.5 ...
-
Consider the irrigation system shown below. The system consists of a reservoir with a maximum depth of h=2.5m, 5 sections of piping with a diameter of 5cm, 2 pipe bends (r/d=3), a wide-open globe...
-
Bangkok Instruments, Ltd.(A). Bangkok Instruments, Ltd., the Thai subsidiary of a U.S. corporation, is a seismic instrument manufacturer. Bangkok Instruments manufactures the instruments primarily...
-
Question 6.10 Current and deferred tax worksheets and tax entries From the hip Ltd?s statement of profit or loss for the year ended 30 June 2007 and extracts from its statements of financial position...
-
This year Jack intends to file a married joint return. Jack received $167,500 of salary and paid $5,000 of interest on loans used to pay qualified tuition costs for his dependent daughter, Deb. This...
-
Illini Corporation reported taxable income of $500,000 from operations for this year. The company paid federal income taxes of $105,000 on this taxable income. During the year, the company made a...
-
Compare and contrast when taxpayers are allowed to deduct the cost of warranties provided by others to the taxpayer (i.e., purchased by the taxpayer) and when taxpayers are allowed to deduct the...
-
Determine the probability mass function of \(X\) from the following cumulative distribution function: \[ F(x)=\left\{\begin{array}{lr} 0 & x. \] Figure 3.3 displays a plot of \(F(x)\). From the plot,...
-
Two new product designs are to be compared on the basis of revenue potential. Marketing believes that the revenue from design A can be predicted quite accurately to be \(\$ 3\) million. The revenue...
-
The probability that a wafer contains a large particle of contamination is 0.01. If it is assumed that the wafers are independent, what is the probability that exactly 125 wafers need to be analyzed...

Study smarter with the SolutionInn App