

Question: On the right is the data from 30 sample groups showing the number of defects in of the samples . The sample size for each
On the right is the data from 30 sample groups showing the number of defects in of the samples . The sample size for each group is 100. Based on this information :
1) What the average defects for this group? 2) What is the standard deviation ?
3) What is the UCL ?
4) What is the LCL?
5) Is this process in control ?
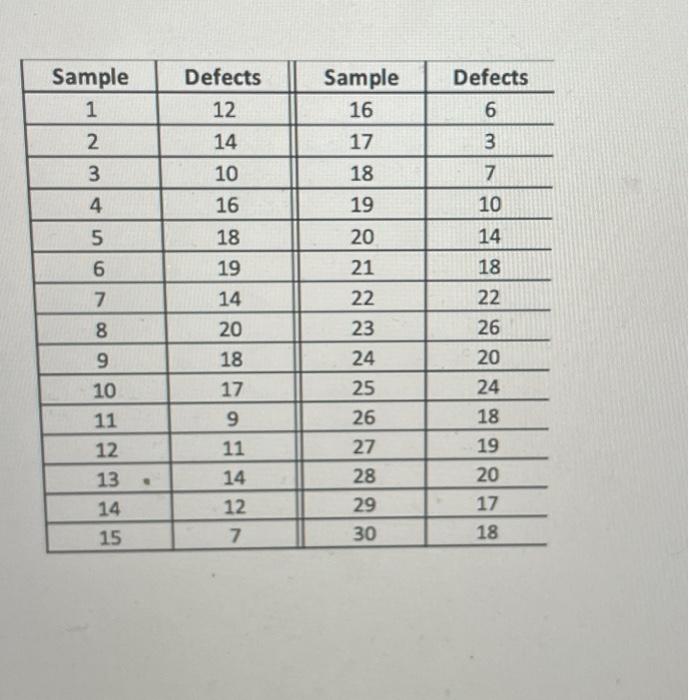
\begin{tabular}{|c|c||c|c} \hline Sample & Defects & Sample & Defects \\ \hline 1 & 12 & 16 & 6 \\ \hline 2 & 14 & 17 & 3 \\ \hline 3 & 10 & 18 & 7 \\ \hline 4 & 16 & 19 & 10 \\ \hline 5 & 18 & 20 & 14 \\ \hline 6 & 19 & 21 & 18 \\ \hline 7 & 14 & 22 & 22 \\ \hline 8 & 20 & 23 & 26 \\ \hline 9 & 18 & 24 & 20 \\ \hline 10 & 17 & 25 & 24 \\ \hline 11 & 9 & 26 & 18 \\ \hline 12 & 11 & 27 & 19 \\ \hline 13 & 14 & 28 & 20 \\ \hline 14 & 12 & 29 & 17 \\ \hline 15 & 7 & 30 & 18 \\ \hline \end{tabular}
Step by Step Solution
There are 3 Steps involved in it
1 Expert Approved Answer
Step: 1 Unlock

Question Has Been Solved by an Expert!
Get step-by-step solutions from verified subject matter experts
Step: 2 Unlock
Step: 3 Unlock