

Question: On the Summary by Type worksheet, modify the Sparklines. a . Change the Sparklines to lines. b . Apply the Quick Style Blue, Sparkline Style
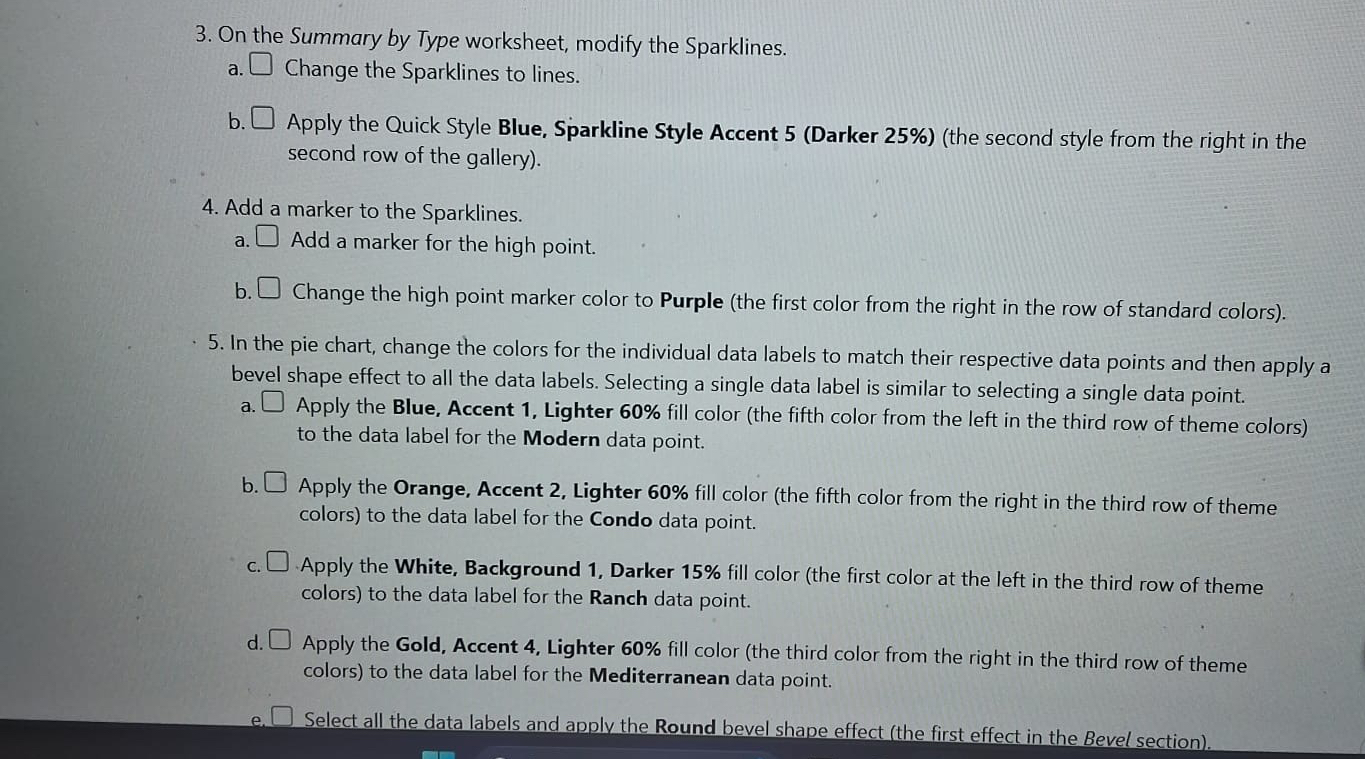
On the Summary by Type worksheet, modify the Sparklines.
a Change the Sparklines to lines.
b Apply the Quick Style Blue, Sparkline Style Accent Darker the second style from the right in the second row of the gallery
Add a marker to the Sparklines.
a Add a marker for the high point.
b Change the high point marker color to Purple the first color from the right in the row of standard colors
In the pie chart, change the colors for the individual data labels to match their respective data points and then apply a bevel shape effect to all the data labels. Selecting a single data label is similar to selecting a single data point.
a Apply the Blue, Accent Lighter fill color the fifth color from the left in the third row of theme colors to the data label for the Modern data point.
b Apply the Orange, Accent Lighter fill color the fifth color from the right in the third row of theme colors to the data label for the Condo data point.
c Apply the White, Background Darker fill color the first color at the left in the third row of theme colors to the data label for the Ranch data point.
d Apply the Gold, Accent Lighter fill color the third color from the right in the third row of theme colors to the data label for the Mediterranean data point.
e Select all the data labels and apply the Round bevel shape effect the first effect in the Bevel section
Step by Step Solution
There are 3 Steps involved in it
1 Expert Approved Answer
Step: 1 Unlock

Question Has Been Solved by an Expert!
Get step-by-step solutions from verified subject matter experts
Step: 2 Unlock
Step: 3 Unlock