

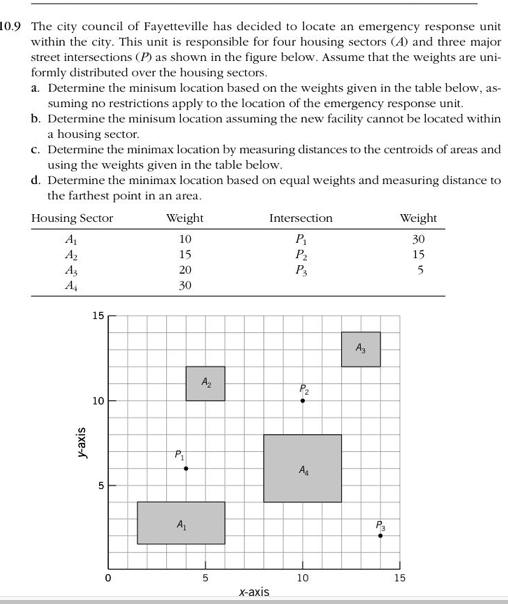
Question: only a and c for a ( draw graph as with Figure 10.10 ) for c ( use solver use Solver for rectilinear solution) 10.9
only a and c
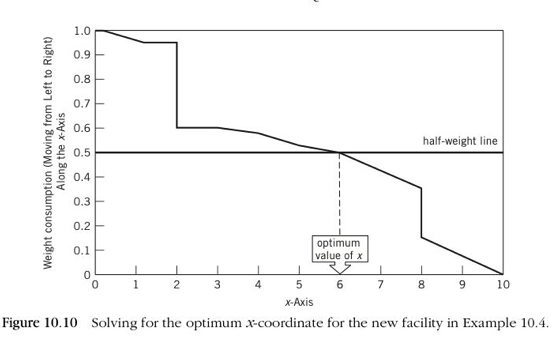
for a ( draw graph as with Figure 10.10 )
for c ( use solver use Solver for rectilinear solution)
Step by Step Solution
There are 3 Steps involved in it
1 Expert Approved Answer
Step: 1 Unlock

Question Has Been Solved by an Expert!
Get step-by-step solutions from verified subject matter experts
Step: 2 Unlock
Step: 3 Unlock