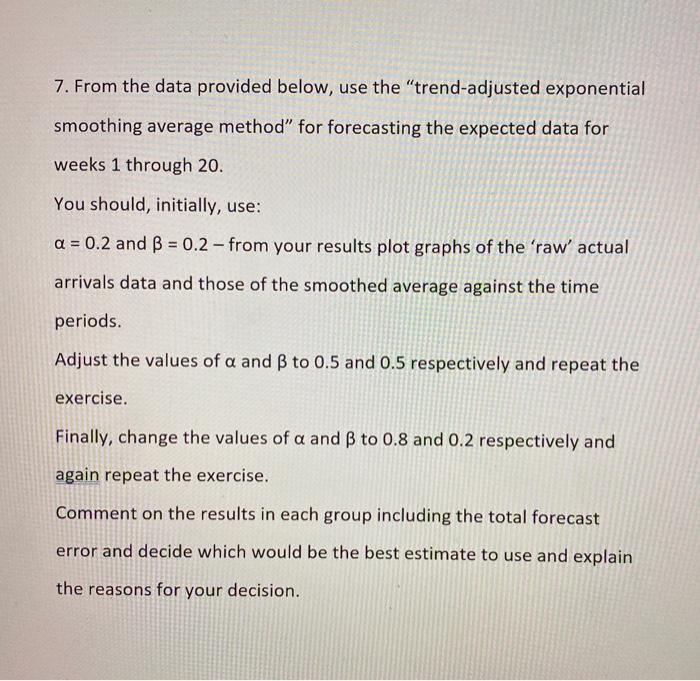
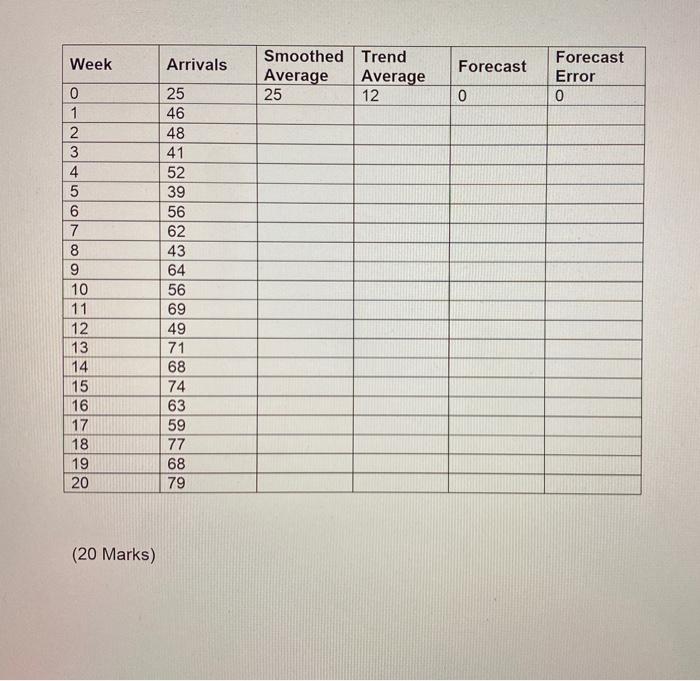
Question: operations management 7. From the data provided below, use the trend-adjusted exponential smoothing average method for forecasting the expected data for weeks 1 through 20.

operations management
operations management 7. From the data provided
7. From the data provided below, use the "trend-adjusted exponential smoothing average method" for forecasting the expected data for weeks 1 through 20. You should, initially, use: a = 0.2 and B = 0.2 - from your results plot graphs of the 'raw'actual arrivals data and those of the smoothed average against the time periods. Adjust the values of a and B to 0.5 and 0.5 respectively and repeat the exercise. Finally, change the values of a and B to 0.8 and 0.2 respectively and again repeat the exercise. Comment on the results in each group including the total forecast error and decide which would be the best estimate to use and explain the reasons for your decision. Week Arrivals Forecast Smoothed Trend Average Average 25 12 Forecast Error 0 0 0 1 2 25 46 48 WN 41 52 39 56 62 43 4 5 6 7 8 9 10 11 12 13 14 15 16 17 18 19 20 64 56 69 49 71 68 74 63 59 77 68 79 (20 Marks)

Step by Step Solution

There are 3 Steps involved in it

1 Expert Approved Answer
Step: 1 Unlock blur-text-image
Question Has Been Solved by an Expert!

Get step-by-step solutions from verified subject matter experts

Step: 2 Unlock
Step: 3 Unlock

Students Have Also Explored These Related General Management Questions!