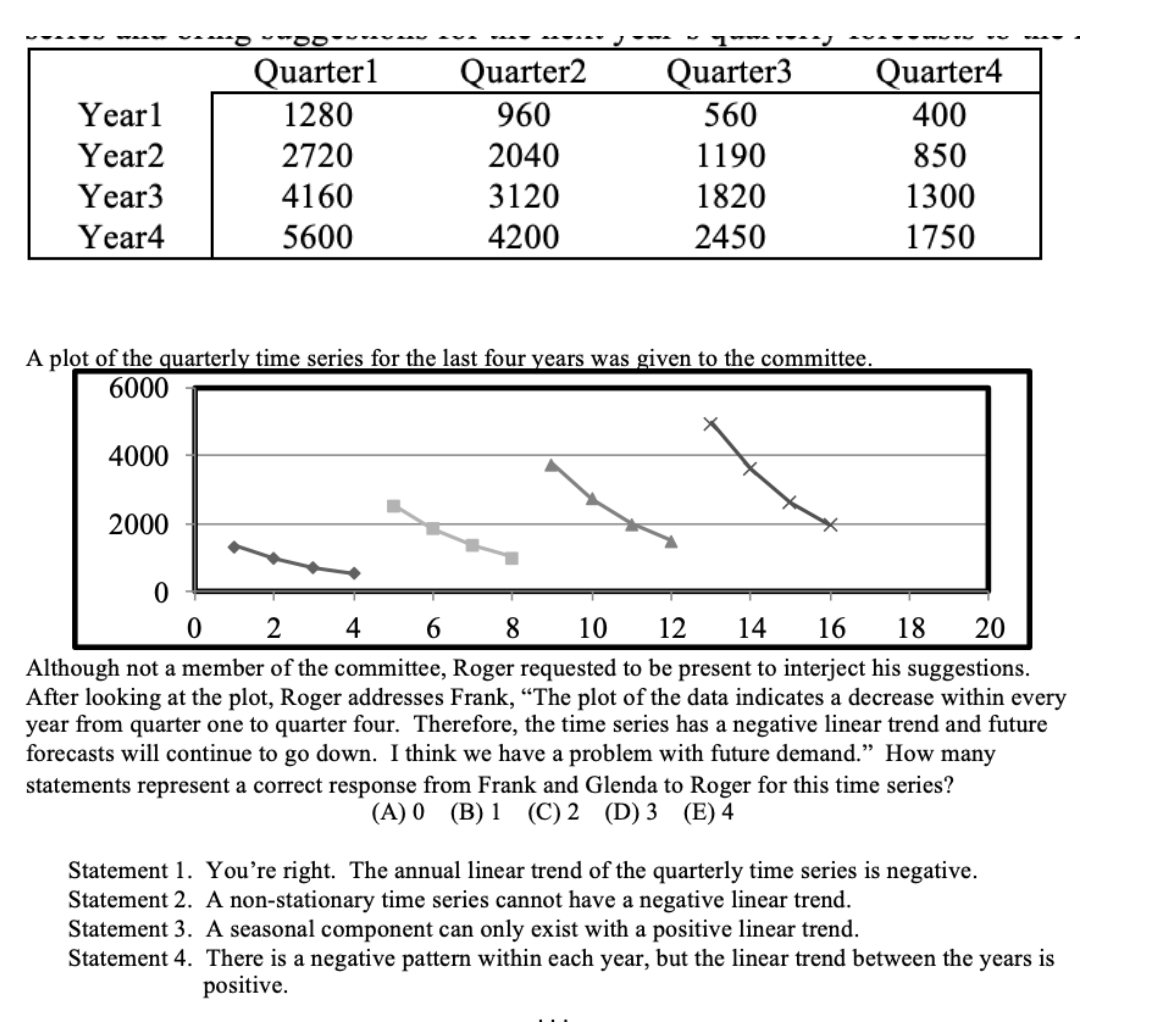
Question: OPERATIONS MANAGEMENT CLASS ** DO NOT COPY FROM OTHERS ** Year1 Year2 Year3 Year4 Quarter1 1280 2720 4160 5600 Quarter2 960 2040 3120 4200 Quarter3

OPERATIONS MANAGEMENT CLASS

** DO NOT COPY FROM OTHERS **

OPERATIONS MANAGEMENT CLASS ** DO NOT COPY FROM

Year1 Year2 Year3 Year4 Quarter1 1280 2720 4160 5600 Quarter2 960 2040 3120 4200 Quarter3 560 1190 1820 2450 Quarter4 400 850 1300 1750 A plot of the quarterly time series for the last four years was given to the committee. 6000 4000 2000 0 0 2 4 6 8 10 12 14 16 18 20 Although not a member of the committee, Roger requested to be present to interject his suggestions. After looking at the plot, Roger addresses Frank, The plot of the data indicates a decrease within every year from quarter one to quarter four. Therefore, the time series has a negative linear trend and future forecasts will continue to go down. I think we have a problem with future demand. How many statements represent a correct response from Frank and Glenda to Roger for this time series? (A)0 (B)1 (C) 2 (D) 3 (E) 4 Statement 1. You're right. The annual linear trend of the quarterly time series is negative. Statement 2. A non-stationary time series cannot have a negative linear trend. Statement 3. A seasonal component can only exist with a positive linear trend. Statement 4. There is a negative pattern within each year, but the linear trend between the years is positive

Step by Step Solution

There are 3 Steps involved in it

1 Expert Approved Answer
Step: 1 Unlock blur-text-image
Question Has Been Solved by an Expert!

Get step-by-step solutions from verified subject matter experts

Step: 2 Unlock
Step: 3 Unlock

Students Have Also Explored These Related General Management Questions!