

Question: Operations Management Question help Question 3 (3 points) Saved The graph below contains three lines. One line is the actual sales, one line is a
Operations Management Question help
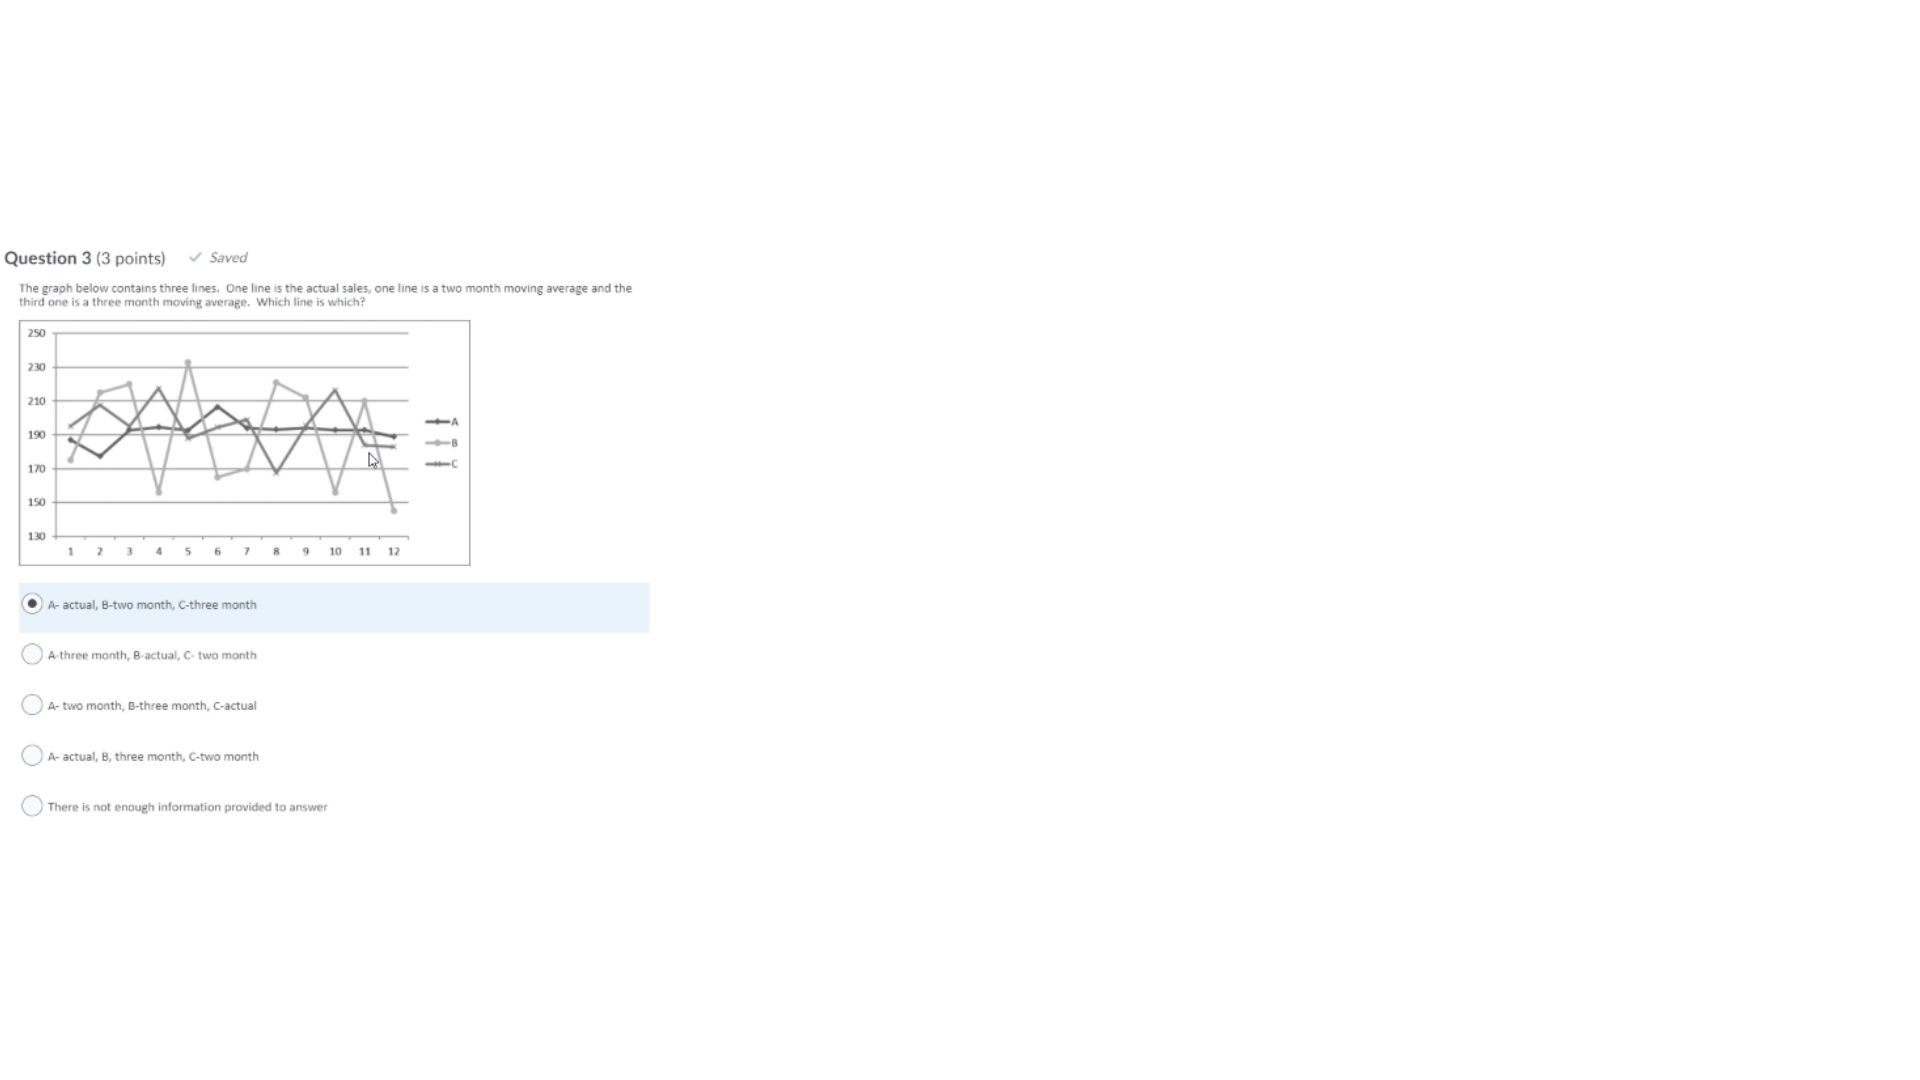
Question 3 (3 points) Saved The graph below contains three lines. One line is the actual sales, one line is a two month moving average and the third one is a three month moving average. Which line is which? 250 230 210 190 170 150 130 2 3 4 6 8 9 10 11 12 . A- actual, B-two month, C-three month A-three month, B-actual, C. two month A- two month, B-three month, C-actual A- actual, B, three month, C-two month There is not enough information provided to
Step by Step Solution
There are 3 Steps involved in it
1 Expert Approved Answer
Step: 1 Unlock

Question Has Been Solved by an Expert!
Get step-by-step solutions from verified subject matter experts
Step: 2 Unlock
Step: 3 Unlock