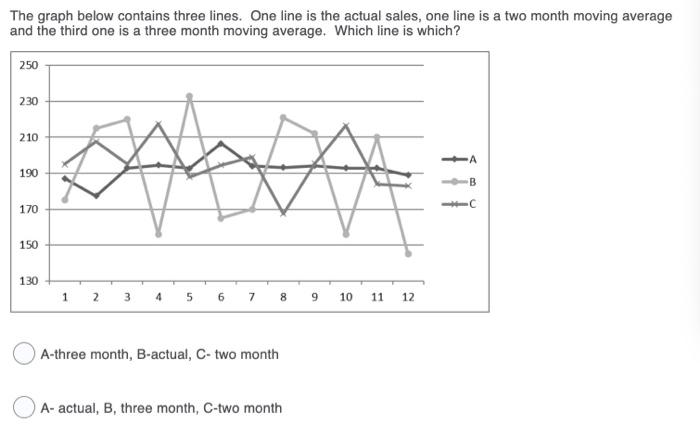
Question: The graph below contains three lines. One line is the actual sales, one line is a two month moving average and the third one is

The graph below contains three lines. One line is
The graph below contains three lines. One line is the actual sales, one line is a two month moving average and the third one is a three month moving average. Which line is which? 250 230 210 A 190 170 150 130 1 2 3 4 5 6 7 8 9 10 11 12 A-three month, B-actual, C-two month A-actual, B, three month, C-two month A-three month, B-actual, C-two month A-actual, B, three month, C-two month A- actual, B-two month, C-three month There is not enough information provided to answer A- two month, B-three month, C-actual

Step by Step Solution

There are 3 Steps involved in it

1 Expert Approved Answer
Step: 1 Unlock blur-text-image
Question Has Been Solved by an Expert!

Get step-by-step solutions from verified subject matter experts

Step: 2 Unlock
Step: 3 Unlock

Students Have Also Explored These Related General Management Questions!