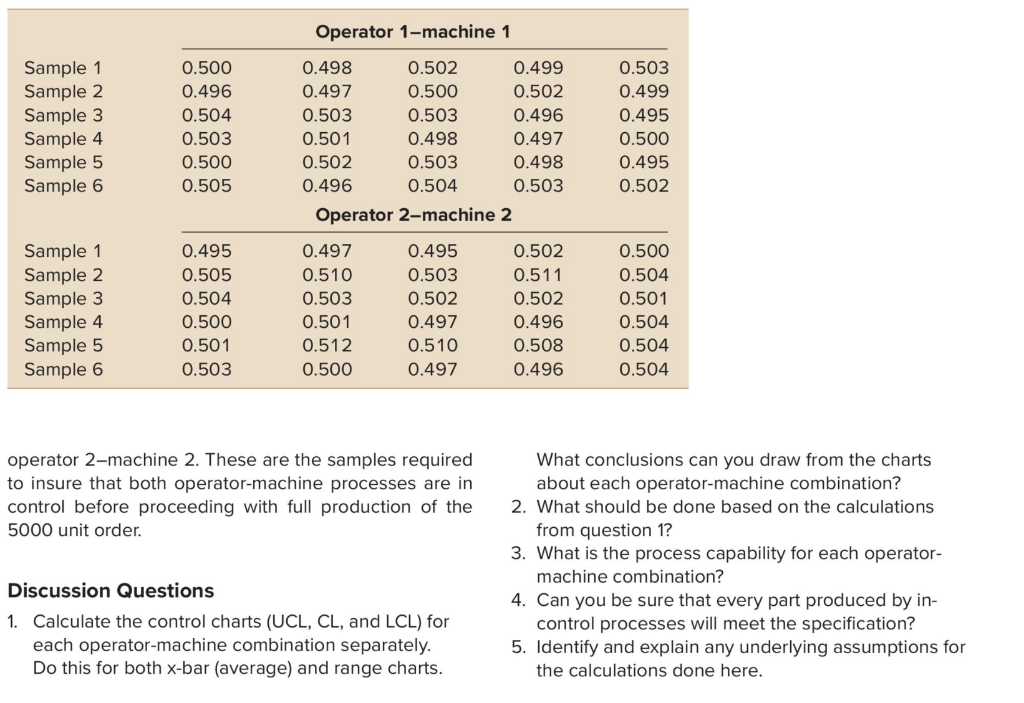
Question: Operator 1-machine 1 Sample 1 Sample 2 Sample 3 Sample 4 Sample 5 Sample 6 0.500 0.496 0.504 0.503 0.500 0.505 0.503 0.499 0.495 0.500

Operator 1-machine 1 Sample 1 Sample 2 Sample 3

Operator 1-machine 1 Sample 1 Sample 2 Sample 3 Sample 4 Sample 5 Sample 6 0.500 0.496 0.504 0.503 0.500 0.505 0.503 0.499 0.495 0.500 0.495 0.502 0.498 0.502 0.499 0.497 0.500 0.502 0.503 0.503 0.496 0.501 0.498 0.497 0.502 0.503 0.498 0.496 0.504 0.503 Operator 2-machine 2 0.497 0.495 0.502 0.510 0.503 0.511 0.503 0.502 0.502 0.501 0.497 0.496 0.512 0.510 0.508 0.500 0.497 0.496 Sample 1 Sample 2 Sample 3 Sample 4 Sample 5 Sample 6 0.495 0.505 0.504 0.500 0.501 0.503 0.500 0.504 0.501 0.504 0.504 0.504 operator 2-machine 2. These are the samples required to insure that both operator-machine processes are in control before proceeding with full production of the 5000 unit order. What conclusions can you draw from the charts about each operator-machine combination? 2. What should be done based on the calculations from question 12 3. What is the process capability for each operator- machine combination? 4. Can you be sure that every part produced by in- control processes will meet the specification? 5. Identify and explain any underlying assumptions for the calculations done here. Discussion Questions 1. Calculate the control charts (UCL, CL, and LCL) for each operator-machine combination separately. Do this for both x-bar (average) and range charts

Step by Step Solution

There are 3 Steps involved in it

1 Expert Approved Answer
Step: 1 Unlock blur-text-image
Question Has Been Solved by an Expert!

Get step-by-step solutions from verified subject matter experts

Step: 2 Unlock
Step: 3 Unlock

Students Have Also Explored These Related General Management Questions!