Question: Option A: Exploring GPS Data Collection and Visualization in AGOL Introduction Geospatial technologies have experienced significant advancements in recent decades, rendering Geographic Information Systems (GIS)
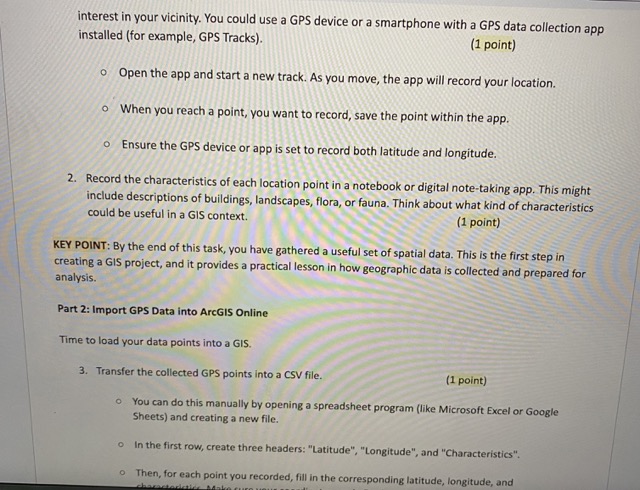
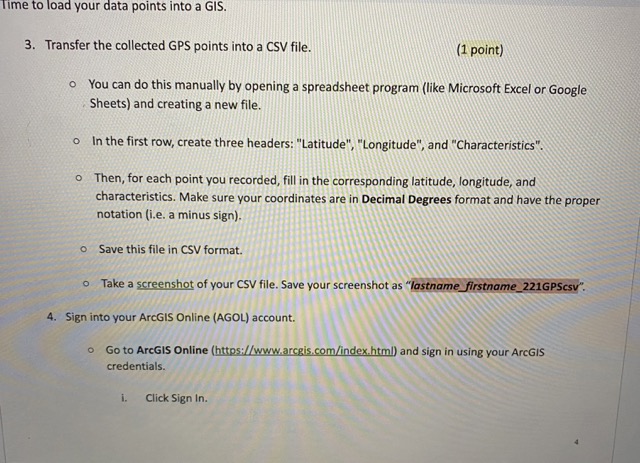
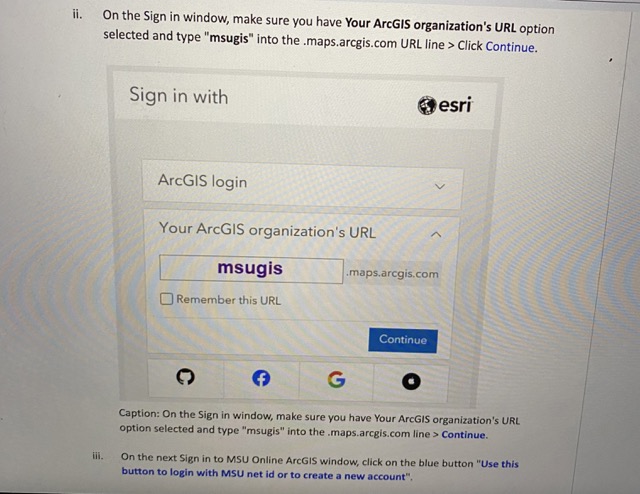
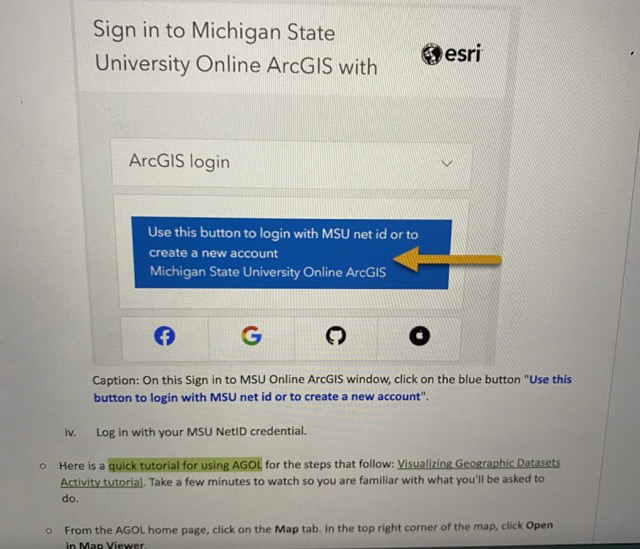
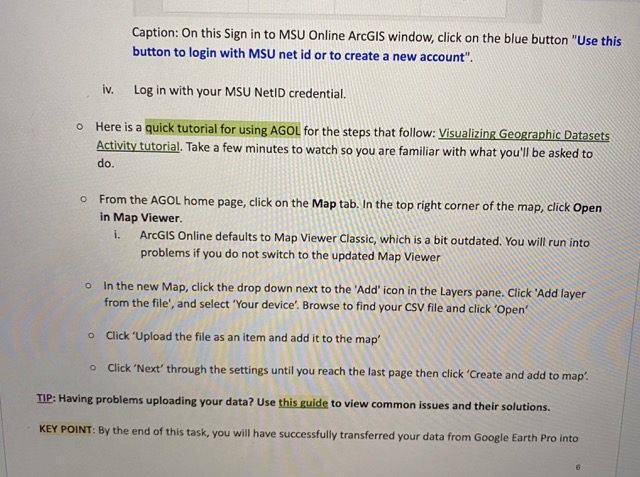
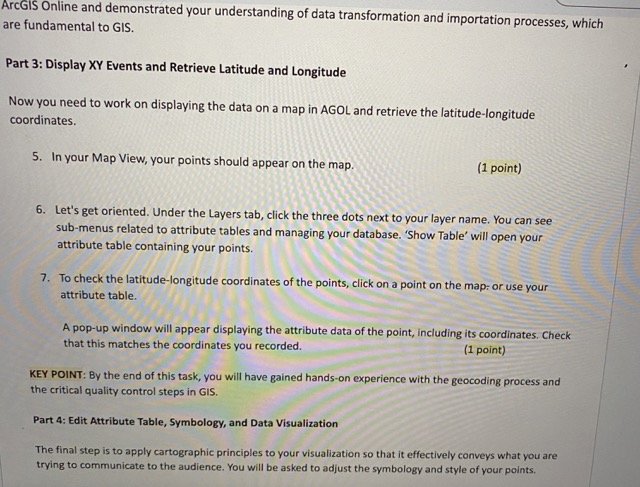
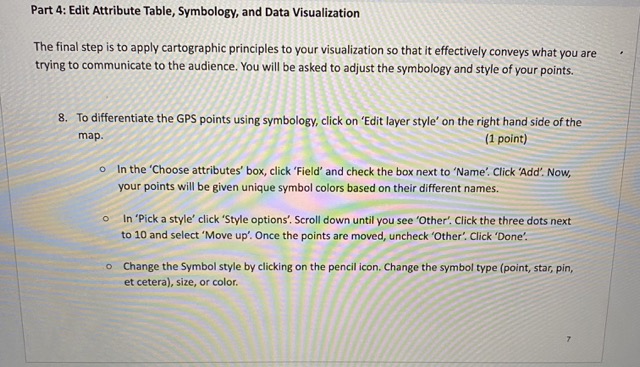
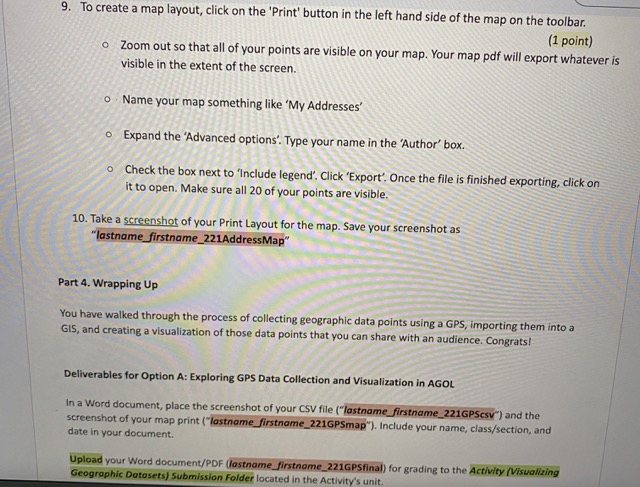
Option A: Exploring GPS Data Collection and Visualization in AGOL Introduction Geospatial technologies have experienced significant advancements in recent decades, rendering Geographic Information Systems (GIS) as crucial tools for various fields, including environmental sciences, urban planning, health care, and more (Longley et al., 2011). In addition, integrating Global Positioning Systems (GPS) data with GIS has further expanded the capabilities of spatial analysis and geospatial data management (Dobson & Fisher, 2007). This activity aims to introduce participants to practical applications of GPS data collection and GIS visualization using ArcGIS software, one of the leading platforms in the GIS industry (ESRI, 2021). The designed activity breaks down the process into clear steps of collecting GPS data, importing the data into ArcGIS, visualizing, and editing attribute data, and manipulating map symbology to create a visually intuitive data set. This hands-on approach encourages participants to learn crucial GIS skills by doing, thus strengthening their understanding and competency in using these technologies. Upon completing this activity, you will have a fundamental understanding of GPS data collection, GIS visualization, and how these technologies are used in the real world to interpret and communicate geographic information. Integrating these technologies: GIS and Global Positioning Systems (GPS), has significantly broadened spatial analysis capabilities, enhancing our ability to capture, manage and interpret geospatial data (Dobson & Fisher, 2007). GPS technology, using satellites, provides precise location data, which can be collected and utilized in various GIS applications. The practical use of GPS data in GIS forms the first part of our activity, providing participants with hands-on experience in gathering and recording location data. Understanding and visualizing these data in a meaningful way is where GIS, and specifically cGIS softwareinformation. Integrating these technologies: GIS and Global Positioning Systems (GPS), has significantly broadened spatial analysis capabilities, enhancing our ability to capture, manage and interpret geospatial data (Dobson & Fisher, 2007). GPS technology, using satellites, provides precise location data, which can be collected and utilized in various GIS applications. The practical use of GPS data in GIS forms the first part of our activity, providing participants with hands-on experience in gathering and recording location data. Understanding and visualizing these data in a meaningful way is where GIS, and specifically ArcGIS software, comes into play. The power of GIS is in its ability to connect data with geography, thus aiding in understanding spatial patterns and relationships (Tomlinson, 2007). By incorporating collected GPS data into ArcGIS, participants will get first-hand experience in mapping and visualization, a crucial skill in various professional fields. Further, data enhancement techniques such as attribute editing, and symbology are pivotal in refining the representation of GIS data. These techniques allow for the customization of data representation based on different criteria, thereby improving interpretability (Slocum et al., 2009). Our activity incorporates these aspects, allowing participants to experiment and understand how data can be visually manipulated to enhance meaning and readability. Upon completing this activity, you are expected to gain a solid foundation in GPS data collection, GIS visualization, and practical usage of ArcGIS software. This will equip you with vital skills used in numerous industries and foster an appreciation of the importance and value of geospatial technologies in understanding 2Objectives By completing this activity, students will be able to: Collect GPS data points on a GPS device or smartphone. . Create a CSV of data points and collected geographic information. . Import geographic data points into a GIS. . Display the data points in a GIS. . Apply cartographic principles to create an effective geographic visualization. Organization This activity is divided into several parts according to the sequence of steps you will take to collect GPS points, import the GPS data into ArcGIS Online (AGOL for short), display your data, and use cartographic principles to complete your visualization. It is important to note that almost every GIS project, regardless of the complexity, progresses in a similar fashion as the steps below (and the steps of this activity). GPS Data Collection. Import GPS Data to ArcGIS Online. . Display XY Events and Retrieve Latitude and Longitude. . Enhance Your Visualization. Materials/Data You will need to use a GPS-enabled device to collect data, which can be done with a GPS device or a smartphone with a GPS data collection app installed (such as GPS Tracks or Geo Tracker). You will also use ArcGIS Online, which all MSU students have access to using their MSU NetID and password.Materials/Data You will need to use a GPS-enabled device to collect data, which can be done with a GPS device or a smartphone with a GPS data collection app installed (such as GPS Tracks or Geo Tracker). You will also use ArcGIS Online, which all MSU students have access to using their MSU NetID and password. Tip: If you have computer-related issues, the University Help Desk can help out. Please call Michigan State University's 24-hour toll-free help desk for information on online courses, D2L, technical support, enrollment assistance, access to Library resources, or other help before or during your online course. Toll Free: 1-800-844-6200 (North America and Hawaii); 517-432-6200 (Local and International). Part 1: GPS Data Collection Let's collect 20 GPS data points. 1. Use a GPS-enabled device to collect at least 20 different location points. These could be any points ofinterest in your vicinity. You could use a GPS device or a smartphone with a GPS data collection app installed (for example, GPS Tracks). (1 point) o Open the app and start a new track. As you move, the app will record your location. o When you reach a point, you want to record, save the point within the app. o Ensure the GPS device or app is set to record both latitude and longitude. 2. Record the characteristics of each location point in a notebook or digital note-taking app. This might include descriptions of buildings, landscapes, flora, or fauna. Think about what kind of characteristics could be useful in a GIS context. (1 point) KEY POINT: By the end of this task, you have gathered a useful set of spatial data. This is the first step in creating a GIS project, and it provides a practical lesson in how geographic data is collected and prepared for analysis. Part 2: Import GPS Data into ArcGIS Online Time to load your data points into a GIS. 3. Transfer the collected GPS points into a CSV file. (1 point) o You can do this manually by opening a spreadsheet program (like Microsoft Excel or Google Sheets) and creating a new file. In the first row, create three headers: "Latitude", "Longitude", and "Characteristics". o Then, for each point you recorded, fill in the corresponding latitude, longitude, andTime to load your data points into a GIS. 3. Transfer the collected GPS points into a CSV file. (1 point) o You can do this manually by opening a spreadsheet program (like Microsoft Excel or Google Sheets) and creating a new file. o In the first row, create three headers: "Latitude", "Longitude", and "Characteristics". o Then, for each point you recorded, fill in the corresponding latitude, longitude, and characteristics. Make sure your coordinates are in Decimal Degrees format and have the proper notation (i.e. a minus sign). o Save this file in CSV format. Take a screenshot of your CSV file. Save your screenshot as "lastname_firstname_221GPScsv". 4. Sign into your ArcGIS Online (AGOL) account. o Go to ArcGIS Online (https://www.arcgis.com/index.html) and sign in using your ArcGIS credentials. i. Click Sign In.ii. On the Sign in window, make sure you have Your ArcGIS organization's URL option selected and type "msugis" into the .maps.arcgis.com URL line > Click Continue. Sign in with esri ArcGIS login Your ArcGIS organization's URL msugis maps,arcgis.com Remember this URL Continue O) f G O Caption: On the Sign in window, make sure you have Your ArcGIS organization's URL option selected and type "msugis" into the .maps.arcgis.com line > Continue. iii. On the next Sign in to MSU Online ArcGIS window, click on the blue button "Use this button to login with MSU net id or to create a new account".Sign in to Michigan State University Online ArcGIS with esri ArcGIS login Use this button to login with MSU net id or to create a new account Michigan State University Online ArcGIS G O) O Caption: On this Sign in to MSU Online ArcGIS window, click on the blue button "Use this button to login with MSU net id or to create a new account". iv. Log in with your MSU NetID credential. Here is a quick tutorial for using AGOL for the steps that follow: Visualizing Geographic Datasets Activity tutorial. Take a few minutes to watch so you are familiar with what you'll be asked to do. From the AGOL home page, click on the Map tab. In the top right corner of the map, click OpenCaption: On this Sign in to MSU Online ArcGIS window, click on the blue button "Use this button to login with MSU net id or to create a new account". iv. Log in with your MSU NetID credential. o Here is a quick tutorial for using AGOL for the steps that follow: Visualizing Geographic Datasets Activity tutorial. Take a few minutes to watch so you are familiar with what you'll be asked to do. o From the AGOL home page, click on the Map tab. In the top right corner of the map, click Open in Map Viewer. i. ArcGIS Online defaults to Map Viewer Classic, which is a bit outdated. You will run into problems if you do not switch to the updated Map Viewer o In the new Map, click the drop down next to the 'Add" icon in the Layers pane. Click 'Add layer from the file', and select "Your device'. Browse to find your CSV file and click 'Open' o Click 'Upload the file as an item and add it to the map" o Click "Next" through the settings until you reach the last page then click "Create and add to map". TIP: Having problems uploading your data? Use this guide to view common issues and their solutions. KEY POINT: By the end of this task, you will have successfully transferred your data from Google Earth Pro intoArcGIS Online and demonstrated your understanding of data transformation and importation processes, which are fundamental to GIS. Part 3: Display XY Events and Retrieve Latitude and Longitude Now you need to work on displaying the data on a map in AGOL and retrieve the latitude-longitude coordinates. 5. In your Map View, your points should appear on the map. (1 point) 6. Let's get oriented. Under the Layers tab, click the three dots next to your layer name. You can see sub-menus related to attribute tables and managing your database. 'Show Table' will open your attribute table containing your points. 7. To check the latitude-longitude coordinates of the points, click on a point on the map: or use your attribute table. A pop-up window will appear displaying the attribute data of the point, including its coordinates, Check that this matches the coordinates you recorded. (1 point) KEY POINT: By the end of this task, you will have gained hands-on experience with the geocoding process and the critical quality control steps in GIS. Part 4: Edit Attribute Table, Symbology, and Data Visualization The final step is to apply cartographic principles to your visualization so that it effectively conveys what you are trying to communicate to the audience. You will be asked to adjust the symbology and style of your points.Part 4: Edit Attribute Table, Symbology, and Data Visualization The final step is to apply cartographic principles to your visualization so that it effectively conveys what you are trying to communicate to the audience. You will be asked to adjust the symbology and style of your points. 8. To differentiate the GPS points using symbology, click on 'Edit layer style' on the right hand side of the map. (1 point) o In the 'Choose attributes' box, click 'Field' and check the box next to 'Name'. Click 'Add'. Now, your points will be given unique symbol colors based on their different names. In 'Pick a style" click 'Style options'. Scroll down until you see 'Other'. Click the three dots next to 10 and select 'Move up'. Once the points are moved, uncheck "Other'. Click 'Done. Change the Symbol style by clicking on the pencil icon. Change the symbol type (point, star, pin, et cetera), size, or color.9. To create a map layout, click on the 'Print' button in the left hand side of the map on the toolbar. (1 point) o Zoom out so that all of your points are visible on your map. Your map pdf will export whatever is visible in the extent of the screen. o . Name your map something like 'My Addresses' o Expand the 'Advanced options'. Type your name in the 'Author box. 0 Check the box next to 'Include legend'. Click 'Export'. Once the file is finished exporting, click on it to open. Make sure all 20 of your points are visible. 10. Take a screenshot of your Print Layout for the map. Save your screenshot as "lastname_firstname_221AddressMap" Part 4. Wrapping Up You have walked through the process of collecting geographic data points using a GPS, importing them into a GIS, and creating a visualization of those data points that you can share with an audience. Congrats! Deliverables for Option A: Exploring GPS Data Collection and Visualization in AGOL In a Word document, place the screenshot of your CSV file ("lastname_firstname_221GPSesv") and the screenshot of your map print ("lastname_firstname_221GPSmap"). Include your name, class/section, and date in your document. Upload your Word document/PDF (lastname_firstname_221GPSfinal) for grading to the Activity (Visualizing Geographic Datasets) Submission Folder located in the Activity's unit.References for Option A: Exploring GPS Data Collection and Visualization in AGOL 1. Dobson, J.E., & Fisher, P.F. (2007). The Geospatial Revolution. The American Scientist, 95(3), 252-260. 2. Esri - ArcGIS Online Help 3. Longley, P.A., Goodchild, M.F., Maguire, D.J., & Rhind, D.W. (2011). Geographic Information Systems and Science. John Wiley & Sons. 4. ESRI. (2021). What is GIS? Retrieved from https://www.esri.com/en-us/what-is-gis/overview. 5. Slocum, T. A., McMaster, R. B., Kessler, F. C., & Howard, H. H. (2009). Thematic Cartography and Geo-Visualization, Third Edition. Pearson Prentice Hall. 6. Tomlinson, R. (2007). Thinking about GIS: Geographic Information System Planning for Managers. ESRI Press
Step by Step Solution
There are 3 Steps involved in it
1 Expert Approved Answer
Step: 1 Unlock
Question Has Been Solved by an Expert!
Get step-by-step solutions from verified subject matter experts
Step: 2 Unlock
Step: 3 Unlock
Students Have Also Explored These Related Accounting Questions!