

Question: Option Pricing 1. The sample tree you got has 2 steps. Current stock price is $100. Annual volatility o is 20%. Now make this tree
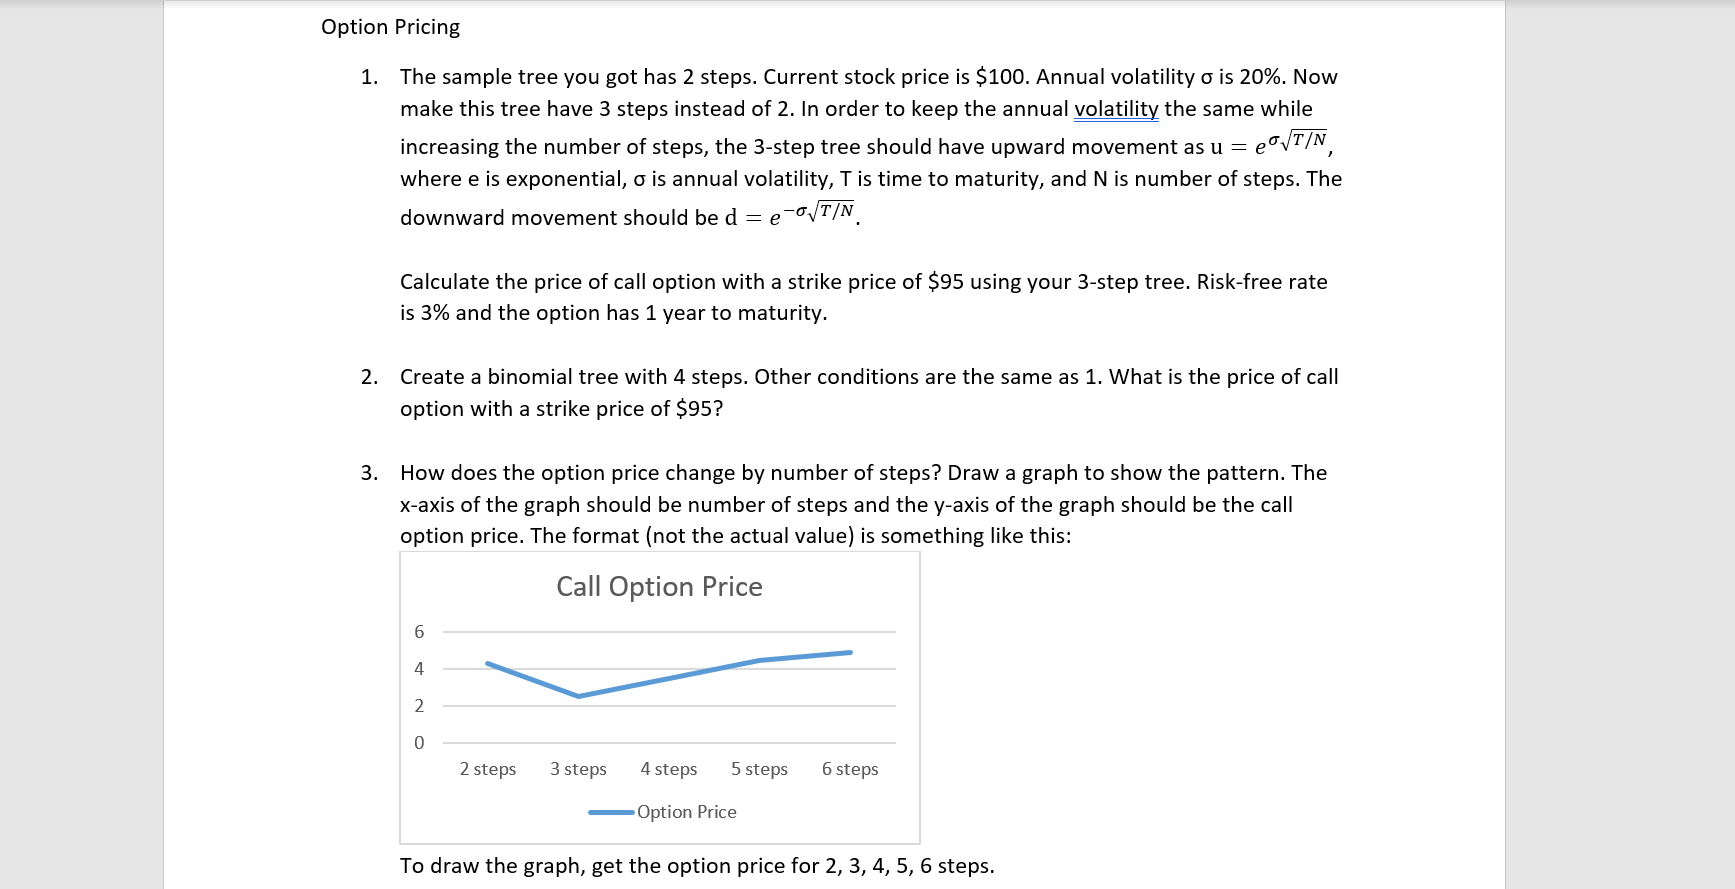
Option Pricing 1. The sample tree you got has 2 steps. Current stock price is $100. Annual volatility o is 20%. Now make this tree have 3 steps instead of 2. In order to keep the annual volatility the same while increasing the number of steps, the 3-step tree should have upward movement as u = pO/T/N, where e is exponential, o is annual volatility, T is time to maturity, and N is number of steps. The downward movement should be d = e ) -GT/N Calculate the price of call option with a strike price of $95 using your 3-step tree. Risk-free rate is 3% and the option has 1 year to maturity. 2. Create a binomial tree with 4 steps. Other conditions are the same as 1. What is the price of call option with a strike price of $95? 3. How does the option price change by number of steps? Draw a graph to show the pattern. The x-axis of the graph should be number of steps and the y-axis of the graph should be the call option price. The format (not the actual value) is something like this: Call Option Price 6 4 2 0 2 steps 3 steps 4 steps 5 steps 6 steps Option Price To draw the graph, get the option price for 2, 3, 4, 5, 6 steps. Option Pricing 1. The sample tree you got has 2 steps. Current stock price is $100. Annual volatility o is 20%. Now make this tree have 3 steps instead of 2. In order to keep the annual volatility the same while increasing the number of steps, the 3-step tree should have upward movement as u = pO/T/N, where e is exponential, o is annual volatility, T is time to maturity, and N is number of steps. The downward movement should be d = e ) -GT/N Calculate the price of call option with a strike price of $95 using your 3-step tree. Risk-free rate is 3% and the option has 1 year to maturity. 2. Create a binomial tree with 4 steps. Other conditions are the same as 1. What is the price of call option with a strike price of $95? 3. How does the option price change by number of steps? Draw a graph to show the pattern. The x-axis of the graph should be number of steps and the y-axis of the graph should be the call option price. The format (not the actual value) is something like this: Call Option Price 6 4 2 0 2 steps 3 steps 4 steps 5 steps 6 steps Option Price To draw the graph, get the option price for 2, 3, 4, 5, 6 steps
Step by Step Solution
There are 3 Steps involved in it

Get step-by-step solutions from verified subject matter experts