

Question: Options for A: p-chart, c-chart, x bar chart Options for C: Out of control or in control An ad agency tracks the complaints, by week
Options for A: p-chart, c-chart, x bar chart
Options for C: Out of control or in control
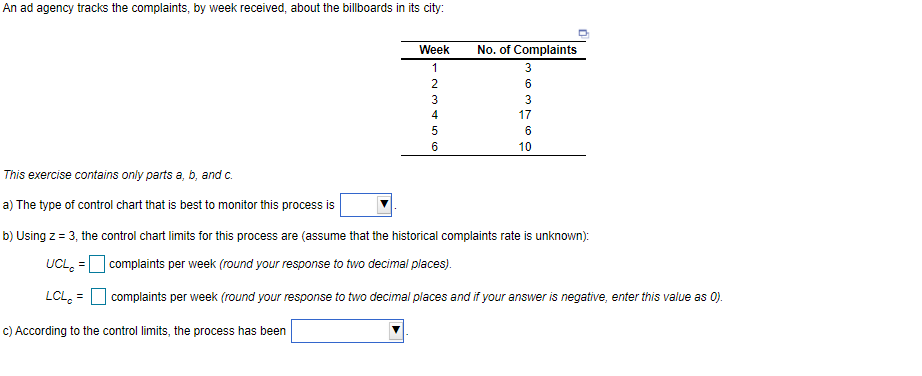
An ad agency tracks the complaints, by week received, about the billboards in its city: Week 1 2 3 4 5 6 OWN No. of Complaints 3 6 3 17 6 10 This exercise contains only parts a, b, and c. a) The type of control chart that is best to monitor this process is b) Using z = 3, the control chart limits for this process are (assume that the historical complaints rate is unknown): UCL - complaints per week (round your response to two decimal places) LCL = complaints per week (round your response to two decimal places and if your answer is negative, enter this value as 0). c) According to the control limits, the process has beenStep by Step Solution
There are 3 Steps involved in it
1 Expert Approved Answer
Step: 1 Unlock

Question Has Been Solved by an Expert!
Get step-by-step solutions from verified subject matter experts
Step: 2 Unlock
Step: 3 Unlock