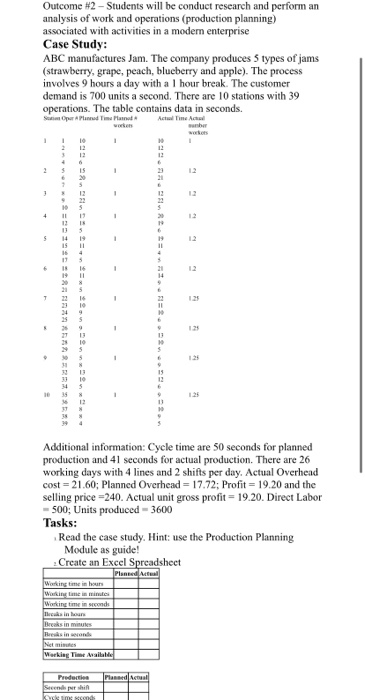
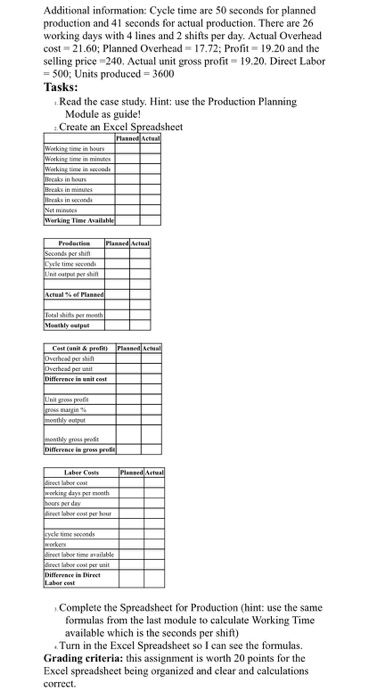
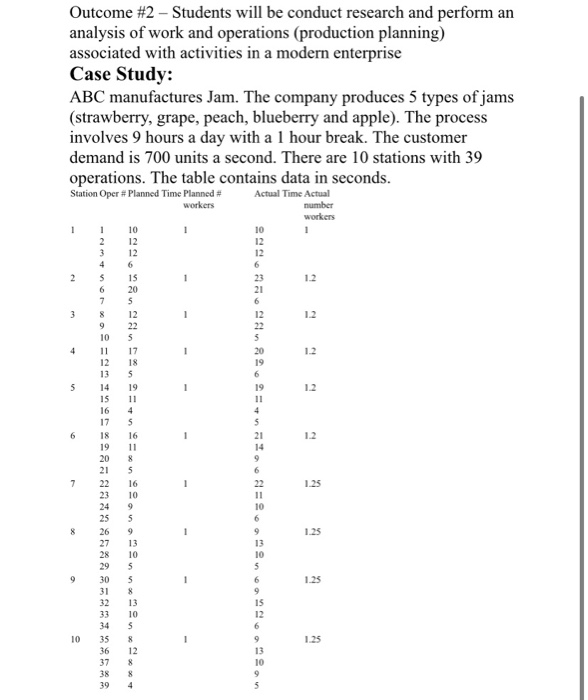
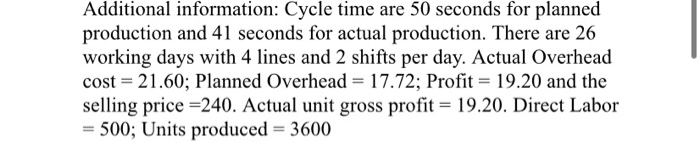
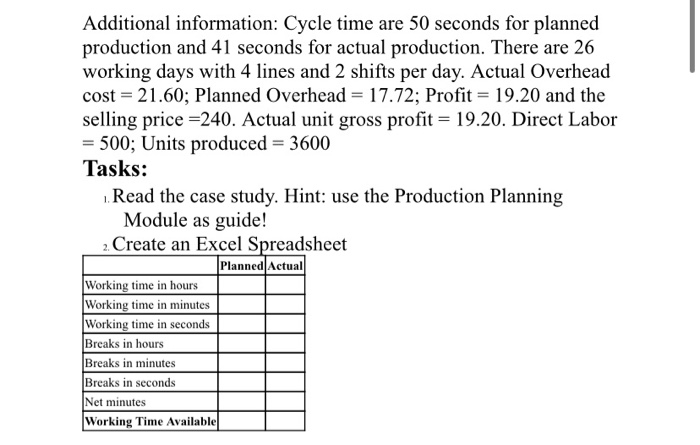
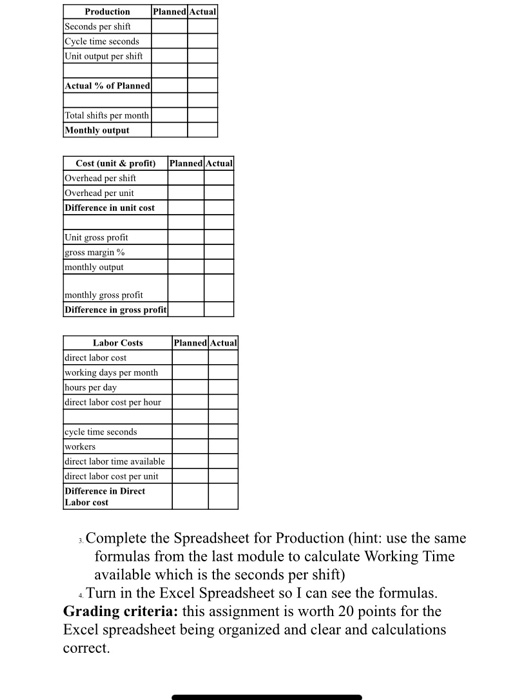
Question: Outcome #2 - Students will be conduct research and perform an analysis of work and operations (production planning) associated with activities in a modern enterprise

Outcome #2 - Students will be conduct research
Outcome #2 - Students will be conduct research and perform an analysis of work and operations (production planning) associated with activities in a modern enterprise Case Study: ABC manufactures Jam. The company produces 5 types of jams (strawberry, grape, peach, blueberry and apple). The process involves 9 hours a day with a 1 hour break. The customer demand is 700 units a second. There are 10 stations with 39 operations. The table contains data in seconds. A Plurras Tiruna Aetart Time Aasai Additional information: Cycle time are 50 seconds for planned production and 41 seconds for actual production. There are 26 working days with 4 lines and 2 shifts per day. Actual Overhead cost = 21.60; Planned Overhead = 17.72; Profit = 19.20 and the selling price=240. Actual unit gross profit = 19.20. Direct Labor 500: Units produced - 3600 Tasks: Read the case study. Hint: use the Production Planning Module as guide! Create an Excel Spreadsheet Planned Send prih Additional information: Cycle time are 50 seconds for planned production and 41 seconds for actual production. There are 26 working days with 4 lines and 2 shifts per day. Actual Overhead cost-21.60; Planned Overhead 17.72; Profit - 19.20 and the selling price240. Actual unit gross profit-19.20. Direct Labor = 500: Units produced = 3600 Tasks: Read the case study. Hint: use the Production Planning Module as guide! Create an Excel Spreadsheet Hasnet Actual kisme in hours ingin seda Ketual of Planned Difference in group Laber Costs Planned Actual Difference in Direct Complete the Spreadsheet for Production (hint: use the same formulas from the last module to calculate Working Time available which is the seconds per shift) Turn in the Excel Spreadsheet so I can see the formulas. Grading criteria: this assignment is worth 20 points for the Excel spreadsheet being organized and clear and calculations correct. Outcome #2 - Students will be conduct research and perform an analysis of work and operations (production planning) associated with activities in a modern enterprise Case Study: ABC manufactures Jam. The company produces 5 types of jams (strawberry, grape, peach, blueberry and apple). The process involves 9 hours a day with a 1 hour break. The customer demand is 700 units a second. There are 10 stations with 39 operations. The table contains data in seconds. Station Oper # Planned Time Planned # Actual Time Actual workers number workers 110 2 12 312 4 6 SS 5 12 10 11 5 12 13 S 14 19 15 11 16 4 175 18 16 19 11 20 8 21 5 16 3310 Additional information: Cycle time are 50 seconds for planned production and 41 seconds for actual production. There are 26 working days with 4 lines and 2 shifts per day. Actual Overhead cost = 21.60; Planned Overhead = 17.72; Profit = 19.20 and the selling price =240. Actual unit gross profit = 19.20. Direct Labor = 500; Units produced = 3600 Additional information: Cycle time are 50 seconds for planned production and 41 seconds for actual production. There are 26 working days with 4 lines and 2 shifts per day. Actual Overhead cost = 21.60; Planned Overhead = 17.72; Profit = 19.20 and the selling price=240. Actual unit gross profit = 19.20. Direct Labor = 500; Units produced = 3600 Tasks: Read the case study. Hint: use the Production Planning Module as guide! 2. Create an Excel Spreadsheet Planned Actual Working time in hours Working time in minutes Working time in seconds Breaks in hours Breaks in minutes Breaks in seconds Net minutes Working Time Available Planned Actual Production Seconds per shit Cycle time seconds Unit output per shift Actual% of Planned Total shifts per month Monthly output Planned Actual Cost (unit & profit) Overhead per shift Overhead per unit Difference in unit cost Unit gross profit gross margin monthly output monthly gross profit Difference in gross profil Planned Actual Labor Costs direct labor cost working days per month hours per day direct labor cost per hour cycle time seconds workers direct labor time available direct labor cost per unit Difference in Direct Labor cost Complete the Spreadsheet for Production (hint: use the same formulas from the last module to calculate Working Time available which is the seconds per shift) Turn in the Excel Spreadsheet so I can see the formulas. Grading criteria: this assignment is worth 20 points for the Excel spreadsheet being organized and clear and calculations correct. Outcome #2 - Students will be conduct research and perform an analysis of work and operations (production planning) associated with activities in a modern enterprise Case Study: ABC manufactures Jam. The company produces 5 types of jams (strawberry, grape, peach, blueberry and apple). The process involves 9 hours a day with a 1 hour break. The customer demand is 700 units a second. There are 10 stations with 39 operations. The table contains data in seconds. A Plurras Tiruna Aetart Time Aasai Additional information: Cycle time are 50 seconds for planned production and 41 seconds for actual production. There are 26 working days with 4 lines and 2 shifts per day. Actual Overhead cost = 21.60; Planned Overhead = 17.72; Profit = 19.20 and the selling price=240. Actual unit gross profit = 19.20. Direct Labor 500: Units produced - 3600 Tasks: Read the case study. Hint: use the Production Planning Module as guide! Create an Excel Spreadsheet Planned Send prih Additional information: Cycle time are 50 seconds for planned production and 41 seconds for actual production. There are 26 working days with 4 lines and 2 shifts per day. Actual Overhead cost-21.60; Planned Overhead 17.72; Profit - 19.20 and the selling price240. Actual unit gross profit-19.20. Direct Labor = 500: Units produced = 3600 Tasks: Read the case study. Hint: use the Production Planning Module as guide! Create an Excel Spreadsheet Hasnet Actual kisme in hours ingin seda Ketual of Planned Difference in group Laber Costs Planned Actual Difference in Direct Complete the Spreadsheet for Production (hint: use the same formulas from the last module to calculate Working Time available which is the seconds per shift) Turn in the Excel Spreadsheet so I can see the formulas. Grading criteria: this assignment is worth 20 points for the Excel spreadsheet being organized and clear and calculations correct. Outcome #2 - Students will be conduct research and perform an analysis of work and operations (production planning) associated with activities in a modern enterprise Case Study: ABC manufactures Jam. The company produces 5 types of jams (strawberry, grape, peach, blueberry and apple). The process involves 9 hours a day with a 1 hour break. The customer demand is 700 units a second. There are 10 stations with 39 operations. The table contains data in seconds. Station Oper # Planned Time Planned # Actual Time Actual workers number workers 110 2 12 312 4 6 SS 5 12 10 11 5 12 13 S 14 19 15 11 16 4 175 18 16 19 11 20 8 21 5 16 3310 Additional information: Cycle time are 50 seconds for planned production and 41 seconds for actual production. There are 26 working days with 4 lines and 2 shifts per day. Actual Overhead cost = 21.60; Planned Overhead = 17.72; Profit = 19.20 and the selling price =240. Actual unit gross profit = 19.20. Direct Labor = 500; Units produced = 3600 Additional information: Cycle time are 50 seconds for planned production and 41 seconds for actual production. There are 26 working days with 4 lines and 2 shifts per day. Actual Overhead cost = 21.60; Planned Overhead = 17.72; Profit = 19.20 and the selling price=240. Actual unit gross profit = 19.20. Direct Labor = 500; Units produced = 3600 Tasks: Read the case study. Hint: use the Production Planning Module as guide! 2. Create an Excel Spreadsheet Planned Actual Working time in hours Working time in minutes Working time in seconds Breaks in hours Breaks in minutes Breaks in seconds Net minutes Working Time Available Planned Actual Production Seconds per shit Cycle time seconds Unit output per shift Actual% of Planned Total shifts per month Monthly output Planned Actual Cost (unit & profit) Overhead per shift Overhead per unit Difference in unit cost Unit gross profit gross margin monthly output monthly gross profit Difference in gross profil Planned Actual Labor Costs direct labor cost working days per month hours per day direct labor cost per hour cycle time seconds workers direct labor time available direct labor cost per unit Difference in Direct Labor cost Complete the Spreadsheet for Production (hint: use the same formulas from the last module to calculate Working Time available which is the seconds per shift) Turn in the Excel Spreadsheet so I can see the formulas. Grading criteria: this assignment is worth 20 points for the Excel spreadsheet being organized and clear and calculations correct

Step by Step Solution

There are 3 Steps involved in it

1 Expert Approved Answer
Step: 1 Unlock blur-text-image
Question Has Been Solved by an Expert!

Get step-by-step solutions from verified subject matter experts

Step: 2 Unlock
Step: 3 Unlock

Students Have Also Explored These Related General Management Questions!