

Question: p2-13 showing financial statement data and stock price data for Mydeco corp i Data Table ri 2012-2016 Financial Statement Data and Stock Price Data for
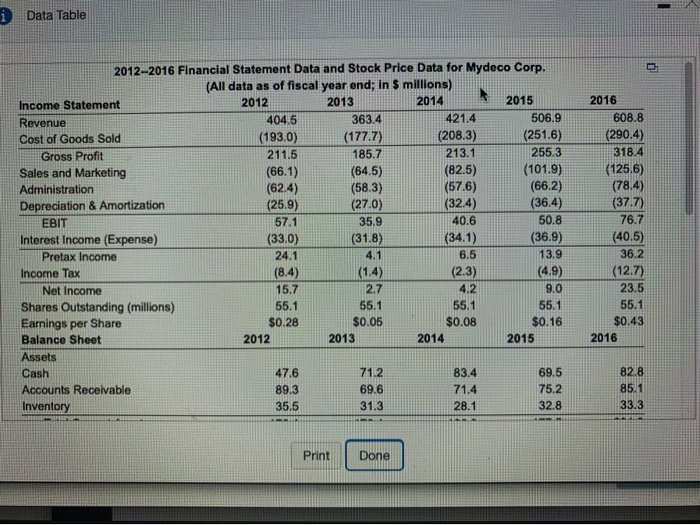
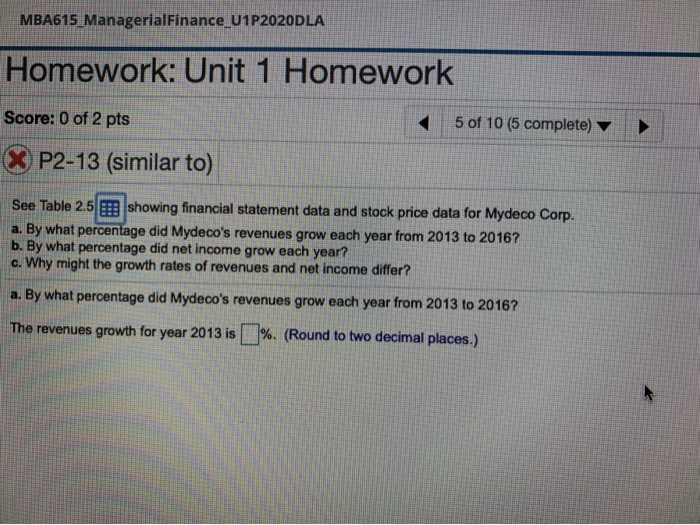
i Data Table ri 2012-2016 Financial Statement Data and Stock Price Data for Mydeco Corp. (All data as of fiscal year end; in $ millions) Income Statement 2012 2013 2014 2015 Revenue 404.5 363.4 421.4 506.9 Cost of Goods Sold (193.0) (177.7) (208.3) (251.6) Gross Profit 211.5 185.7 213.1 255.3 Sales and Marketing (66.1) (64.5) (82.5) (101.9) Administration (62.4) (58.3) (57.6) (66.2) Depreciation & Amortization (25.9) (27.0) (32.4) (36.4) EBIT 57.1 35.9 40.6 50.8 Interest Income (Expense) (33.0) (31.8) (34.1) (36.9) Pretax Income 24.1 4.1 6.5 13.9 Income Tax (8.4) (1.4) (2.3) (4.9) Net Income 15.7 2.7 4.2 9.0 Shares Outstanding (millions) 55.1 55.1 55.1 55.1 Earnings per Share $0.28 $0.05 $0.08 $0.16 Balance Sheet 2012 2013 2014 2015 Assets Cash 47.6 71.2 83.4 69.5 Accounts Receivable 89.3 69.6 71.4 75.2 Inventory 35.5 31.3 28.1 32.8 2016 608.8 (290.4) 318.4 (125.6) (78.4) (37.7) 76.7 (40.5) 36.2 (12.7) 23.5 55.1 $0.43 2016 82.8 85.1 33.3 Print Done MBA615_ManagerialFinance_U1P2020DLA Homework: Unit 1 Homework Score: 0 of 2 pts 5 of 10 (5 complete) (X) P2-13 (similar to) See Table 2.5 E showing financial statement data and stock price data for Mydeco Corp. a. By what percentage did Mydeco's revenues grow each year from 2013 to 2016? b. By what percentage did net income grow each year? c. Why might the growth rates of revenues and net income differ? a. By what percentage did Mydeco's revenues grow each year from 2013 to 2016? The revenues growth for year 2013 is %. (Round to two decimal places.)
Step by Step Solution
There are 3 Steps involved in it

Get step-by-step solutions from verified subject matter experts