

Question: P5-5: The table below shows standard deviations and correlation coefficients for seven stocks from different countries. Calculate the variance of a portfolio with equal investments
P5-5: The table below shows standard deviations and correlation coefficients for seven stocks from different countries. Calculate the variance of a portfolio with equal investments in each stock. (Use decimals, not percents, in your calculations. Do not round intermediate calculations. Round your answer to 4 decimal places.) 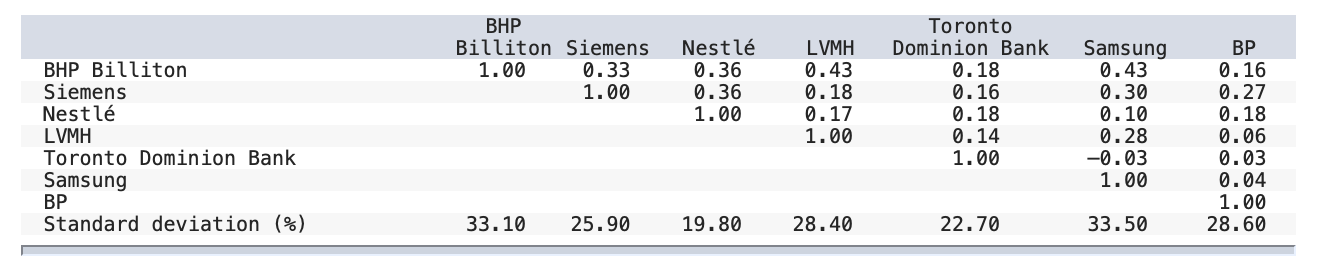

BHP Billiton Siemens Nestl LVMH Toronto Dominion Bank Samsung BP Standard deviation (%) BHP Billiton Siemens 1.00 0.33 1.00 33.10 25.90 Nestl 0.36 0.36 1.00 19.80 Toronto LVMH Dominion Bank 0.43 0.18 0.18 0.16 0.17 0.18 1.00 0.14 1.00 28.40 22.70 Samsung 0.43 0.30 0.10 0.28 -0.03 1.00 33.50 BP 0.16 0.27 0.18 0.06 0.03 0.04 1.00 28.60 Portfolio variance
Step by Step Solution
There are 3 Steps involved in it

Get step-by-step solutions from verified subject matter experts