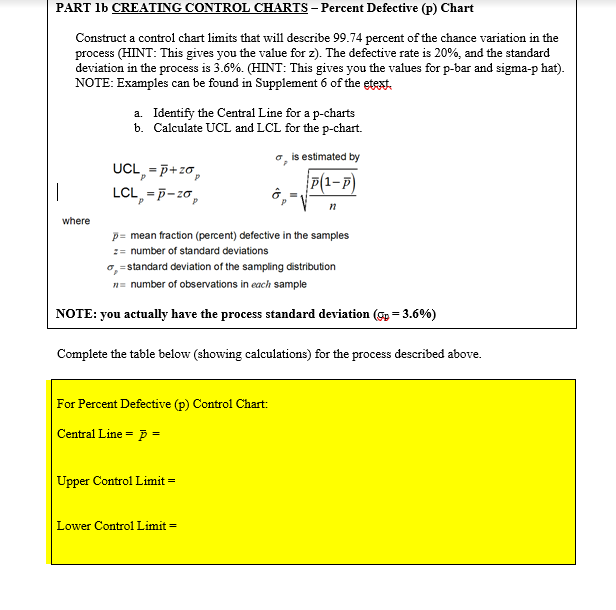
Question: PART 1b CREATING CONTROL CHARTS - Percent Defective (p) Chart Construct a control chart limits that will describe 99.74 percent of the chance variation in

PART 1b CREATING CONTROL CHARTS - PercentPART 1b CREATING CONTROL CHARTS - Percent

PART 1b CREATING CONTROL CHARTS - Percent Defective (p) Chart Construct a control chart limits that will describe 99.74 percent of the chance variation in the process (HINT: This gives you the value for z). The defective rate is 20%, and the standard deviation in the process is 3.6%. (HINT: This gives you the values for p-bar and sigma-p hat). NOTE: Examples can be found in Supplement 6 of the etext a. Identify the Central Line for a p-charts b. Calculate UCL and LCL for the p-chart. o, is estimated by UCL, -p+20, | LCL, TP-70, P(1-) n where p= mean fraction (percent) defective in the samples := number of standard deviations 9, =standard deviation of the sampling distribution = number of observations in each sample NOTE: you actually have the process standard deviation (p = 3.6%) Complete the table below (showing calculations) for the process described above. For Percent Defective (p) Control Chart: Central Line = p = Upper Control Limit - Lower Control Limit = Part 2 - Defective Bottle Control Chart Data Package 1 Package 2 Package 3 Package 4 Total Blue (Bad) Beads 3 Total Blue (Bad) Beads 6 8 Team (Sample) 1 2 3 4 5 6 7 8 9 10 11 4 Total Clear (Good) Beads 27 20 21 19 11 22 29 30 18 28 22 Total Clear (Good) Total Blue Beads (Bad) Beads 21 6 17 3 22 7 21 9 13 2 22 5 21 4 24 4 20 51 18 10 19 6 Total Blue (Bad) Beads 7 6 6 6 5 4 8 5 Total Clear (Good) Beads 20 23 22 21 13 26 24 23 22 25 26 Total Clear (Good) Beads 20 23 25 31 19 20 17 17 18 24 20 8 1 0 TEAM Total Clear (good) Beads 88 83 90 92 56 90 91 94 78 95 87 TEAM Total Blue (bad) Beads 22 22 25 24 12 22 20 16 29 24 22 Percent Defective (bad/total) 20.00% 20.95% 21.74% 20.69% 17.65% 19.64% 18.02% 14.55% 27.10% 20.17% 20.18% 5 8 8 4 4 1 2 13 9 7 4 6 5 6 3 3 7

Step by Step Solution

There are 3 Steps involved in it

1 Expert Approved Answer
Step: 1 Unlock blur-text-image
Question Has Been Solved by an Expert!

Get step-by-step solutions from verified subject matter experts

Step: 2 Unlock
Step: 3 Unlock

Students Have Also Explored These Related General Management Questions!