

Question: Part A ( Figure 1 ) is a snapshot graph at t = 0 s of two waves approaching each other at 1 m s
Part A
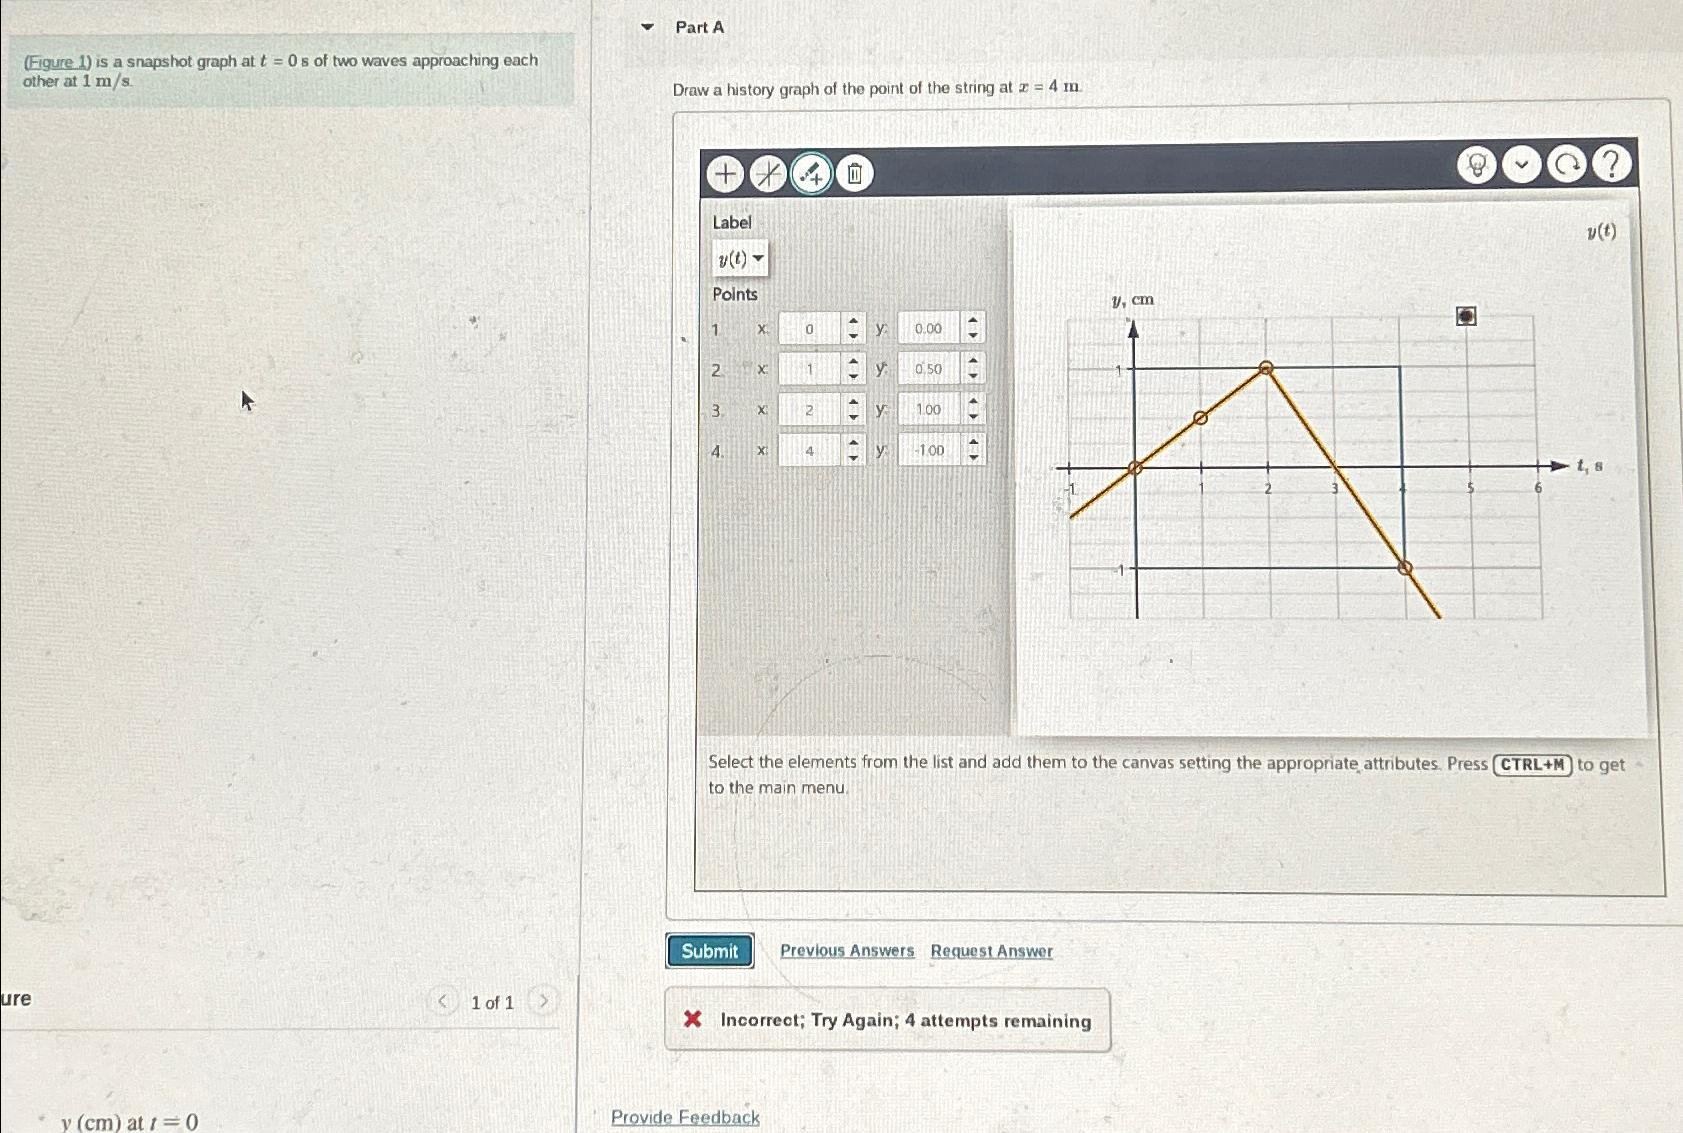
Figure is a snapshot graph at of two waves approaching each other at
Draw a history graph of the point of the string at
Previous Answers
Request Answer
of
at
Provide Feedback
Step by Step Solution
There are 3 Steps involved in it
1 Expert Approved Answer
Step: 1 Unlock

Question Has Been Solved by an Expert!
Get step-by-step solutions from verified subject matter experts
Step: 2 Unlock
Step: 3 Unlock