

Question: FIGURE EX17.3a is a snapshot graph at t = 0 s of two waves approaching each other at 1.0 m/s. At what time was the
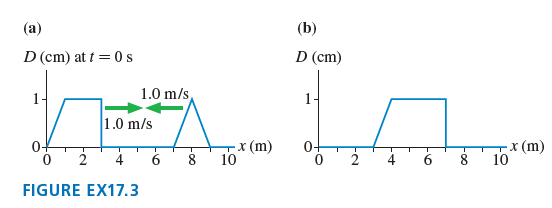
(a) (b) D (cm) at t = 0s D (cm) 1.0 m/s 1- 1- 1.0 m/s 0- 0+ x (m) 10 4 10 6. (u) x FIGURE EX17.3 -4-
Step by Step Solution
★★★★★
3.30 Rating (153 Votes )
There are 3 Steps involved in it
1 Expert Approved Answer
Step: 1 Unlock

Model The principle of superposition comes into play ... View full answer
Question Has Been Solved by an Expert!
Get step-by-step solutions from verified subject matter experts
Step: 2 Unlock
Step: 3 Unlock