

Question: FIGURE EX17.4 is a snapshot graph at t = 0 s of two waves moving to the right at 1.0 m/s. The string is fixed
FIGURE EX17.4 is a snapshot graph at t = 0 s of two waves moving to the right at 1.0 m/s. The string is fixed at x = 8.0 m. Draw four snapshot graphs, stacked vertically, showing the string at t = 2, 4, 6, and 8 s.
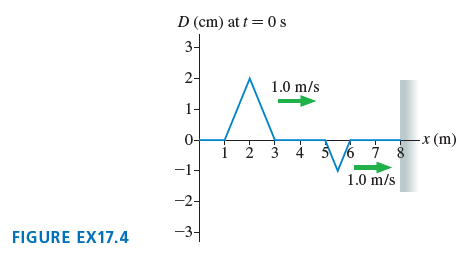
D (cm) at t = 0 s 3- 2- 1.0 m/s 1- -x (m) i 8 0- 2 3 4 3 6 -1- 1.0 m/s -2- -31 FIGURE EX17.4
Step by Step Solution
★★★★★
3.40 Rating (163 Votes )
There are 3 Steps involved in it
1 Expert Approved Answer
Step: 1 Unlock

Model A wave pulse reflected from the stringwall boundary is inverted and its ampli... View full answer
Question Has Been Solved by an Expert!
Get step-by-step solutions from verified subject matter experts
Step: 2 Unlock
Step: 3 Unlock