

Question: PART A) You will need to graph this data (on graph paper) in order to answer the following questions. When you graph the data, scale
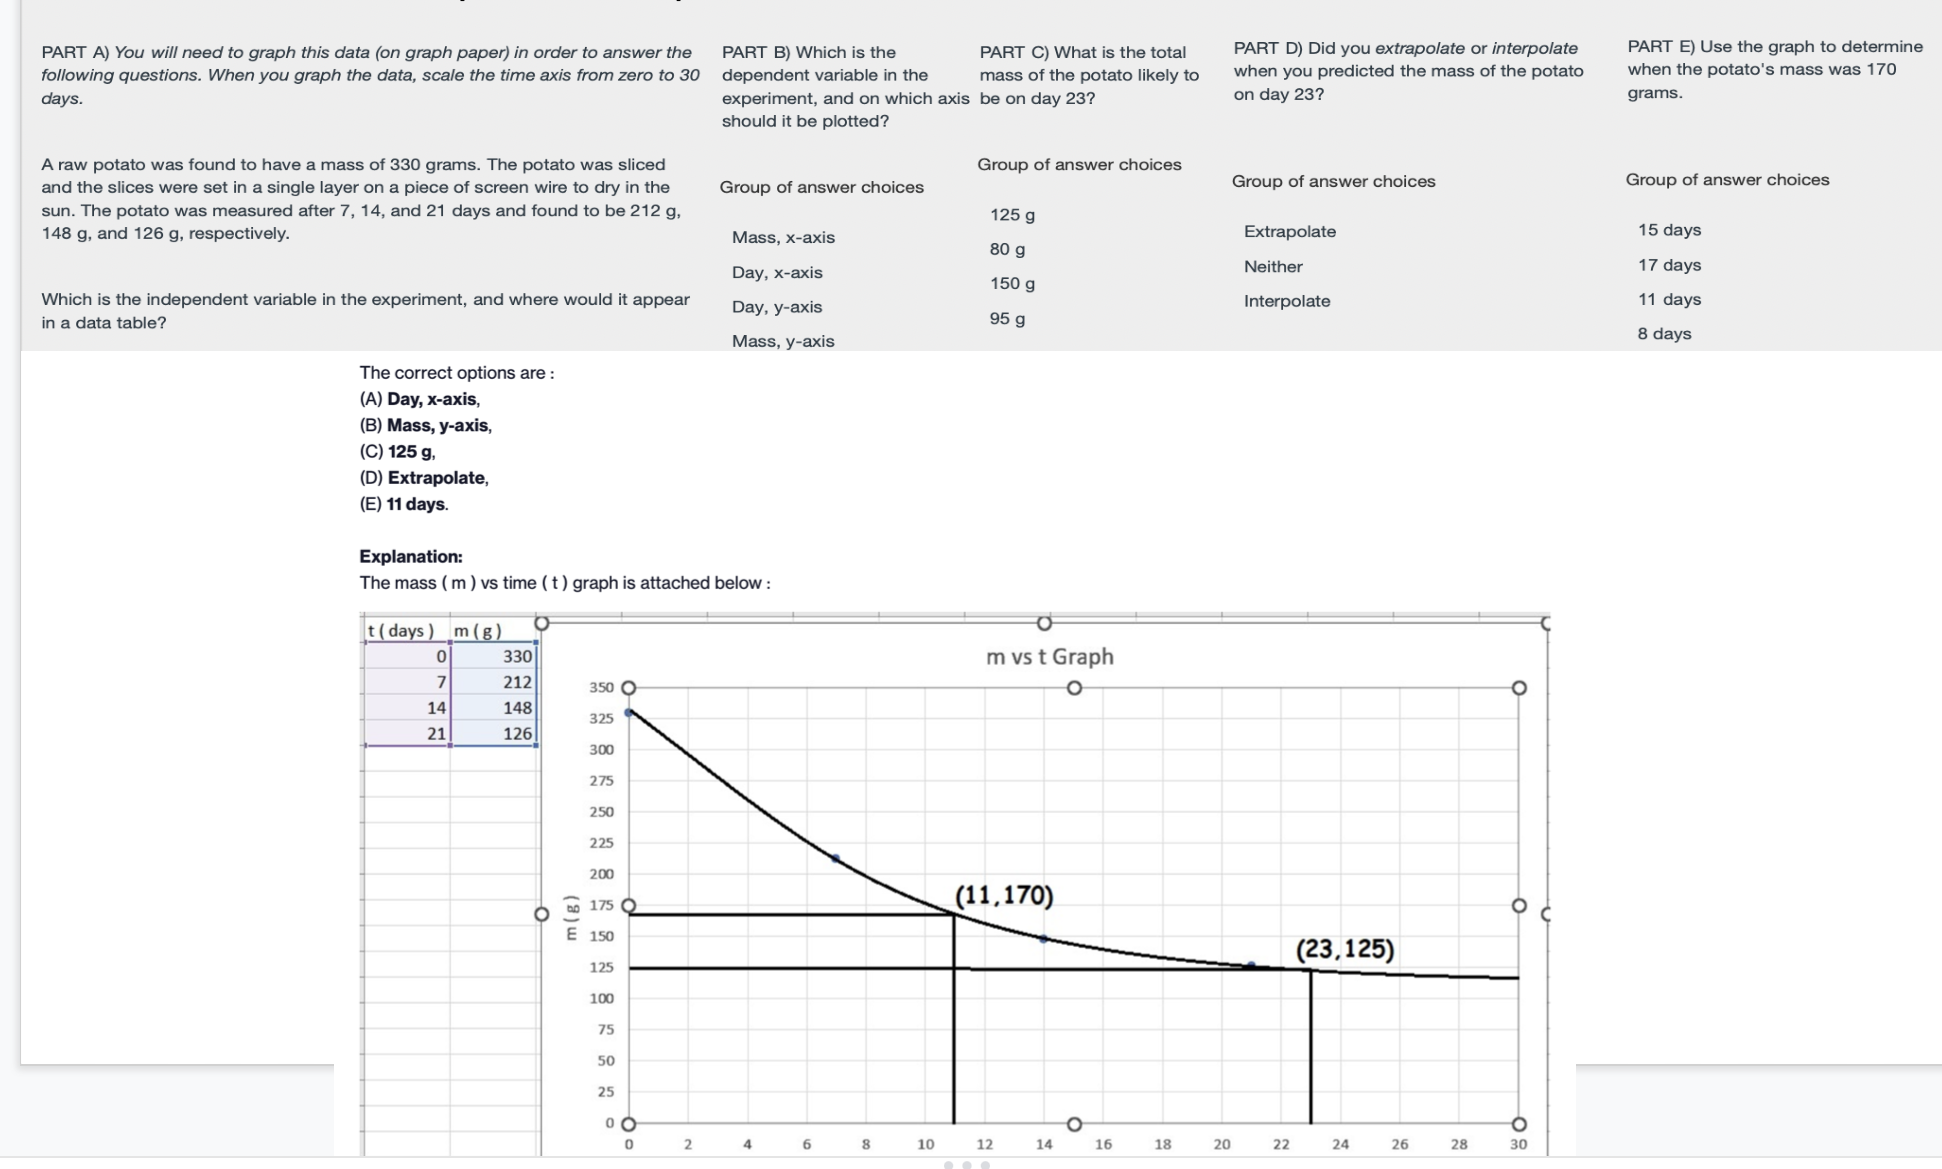
PART A) You will need to graph this data (on graph paper) in order to answer the following questions. When you graph the data, scale the time axis from zen: to 30 days. A raw potato was found to have a mass of 330 grams. The potato was sliced and the slices were set in a single layer on a piece of screen wire to dry in the sun. The potato was measured after 7. 14. and 21 days and found to be 212 g, 148 g, and 126 g. respectively. Which is the independent variable in the experiment. and where would it appear in a data table? The correct options are : (A) Day, x-axis, (B) Mass, y-axis, (C) 125 a. (D) Extrapelete. (E) 11 days. Explanation: PART B) Which is the dependent variable in the PART C) What is the total mass of the potato likely to experiment, and on which axis be on day 237 should it be plotted? Group of answer choices Mass, xeaxis Day, x-axis Day, y-axis Mass. v-axis The mass (mlvstime (t) graph is attached below: sways) 'mlsi , 0 330 7 212 3500 , 14 148 325 121._12". 3w _ ' 275 250 - _ 225 am - o E \"5 E 150 - 125 [CD . ' 75 50 - 25 - A 00 u 2 Group of answer choices 125 g 30 g 150 g 95 g m vstGraph O (11.17! 12 ll 16 ll! PART D) Did you extrapolate or interpolate when you predicted the mass of the potato on day 237 Group of answer choices Extrapolale Neither Interpolate (23,125) 22 15 25 23 30 PART E) Use the graph to determine when the potato's mass was 170 grams. Group of answer choices 1 5 days 1 7 days 11 days a days
Step by Step Solution
There are 3 Steps involved in it

Get step-by-step solutions from verified subject matter experts