

Question: Part A:Assuming all conditions for conducting a hypothesis test are met, what are the no and alternative hypothesis? Part B: identify the test statistic Part
Part A:Assuming all conditions for conducting a hypothesis test are met, what are the no and alternative hypothesis? Part B: identify the test statistic Part C: Identify the P value Part D: State the final conclusion that addresses the original claim. There is (sufficient/ not sufficient) Evidence to conclude that the mean prediction error is equal to zero (is/ is not) correct. There is In the mean production.
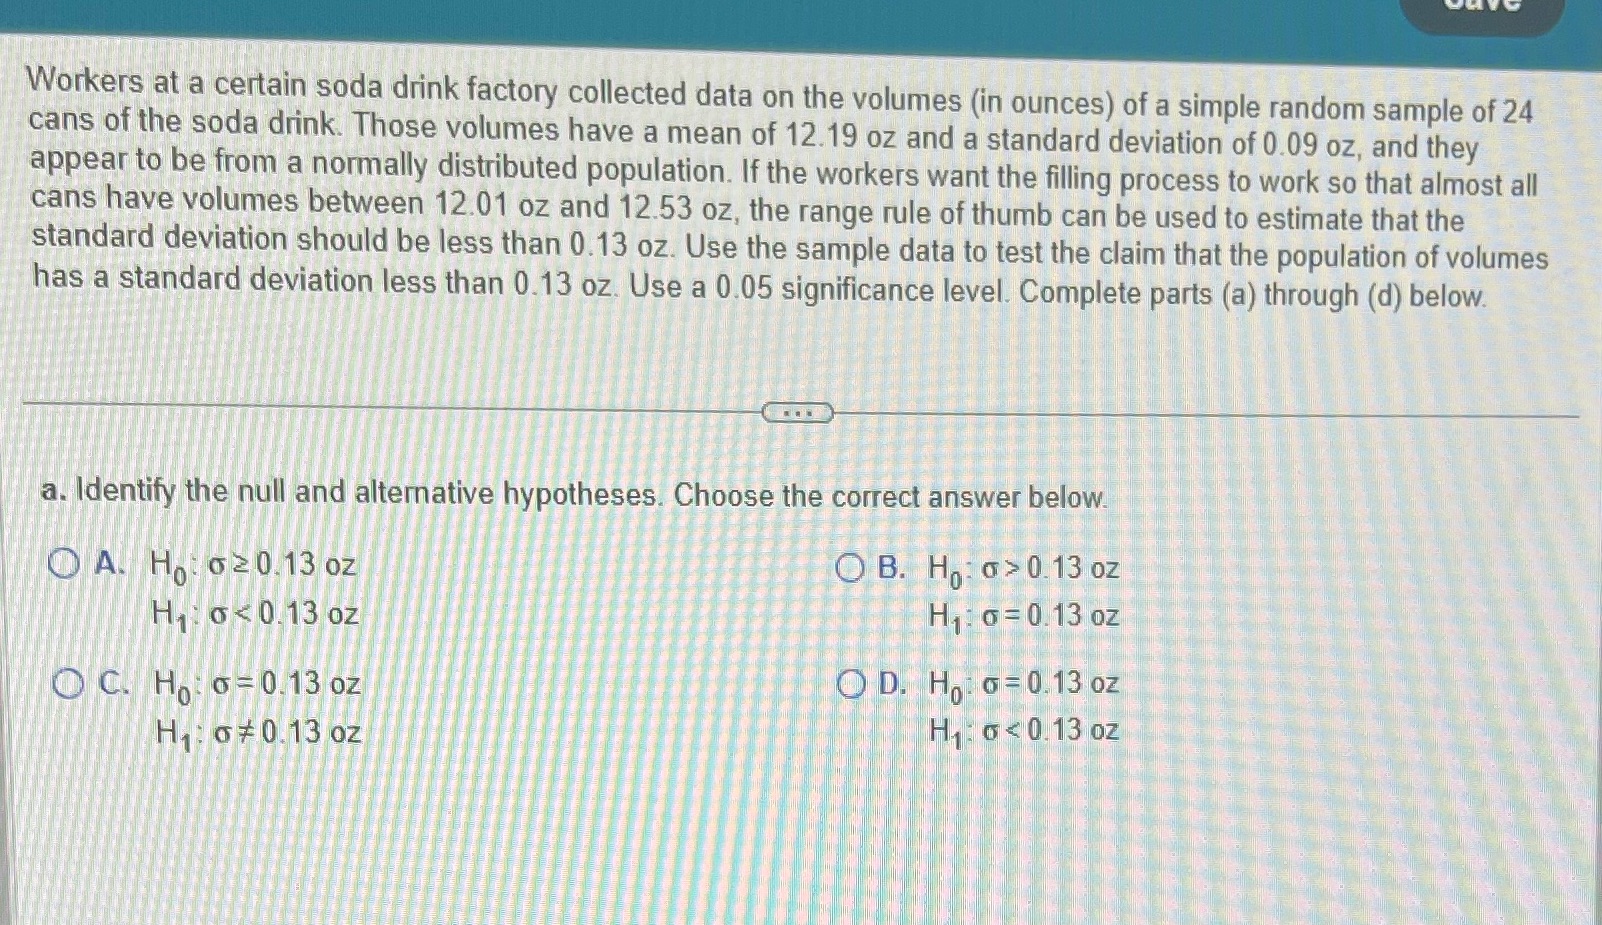
Workers at a certain soda drink factory collected data on the volumes (in ounces) of a simple random sample of 24 cans of the soda drink. Those volumes have a mean of 12.19 oz and a standard deviation of 0.09 oz, and they appear to be from a normally distributed population. If the workers want the filling process to work so that almost all cans have volumes between 12.01 oz and 12.53 oz, the range rule of thumb can be used to estimate that the standard deviation should be less than 0. 13 oz. Use the sample data to test the claim that the population of volumes has a standard deviation less than 0.13 oz. Use a 0.05 significance level. Complete parts (a) through (d) below. a. Identify the null and alternative hypotheses. Choose the correct answer below. A. H: 6 20 13 oz O B. H a > 0 13 oz H,: 6
Step by Step Solution
There are 3 Steps involved in it

Get step-by-step solutions from verified subject matter experts