

Question: PART B The graph below shows monthly data collected on facilities maintenance department costs and on the number of patient-days serviced over the past year.
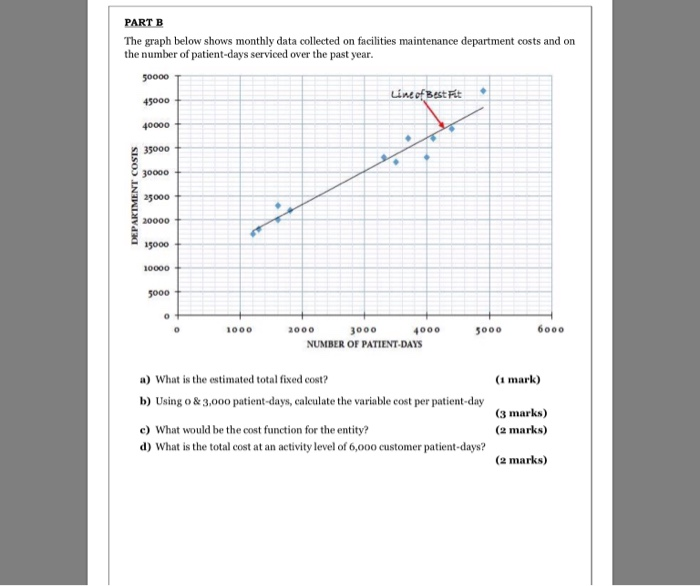
PART B The graph below shows monthly data collected on facilities maintenance department costs and on the number of patient-days serviced over the past year. 50000 Line of Best Fit 45000 40000 2 35000 30000 COSIS DEPARTMENT 25000 320000 15000 VOOL 1000 5000 6000 2000 3000 4000 NUMBER OF PATIENT-DAYS a) What is the estimated total fixed cost? (1 mark) b) Using o& 3,000 patient-days, calculate the variable cost per patient-day (3 marks) (2 marks) c) What would be the cost function for the entity? d) What is the total cost at an activity level of 6,000 customer patient-days? (2 marks)
Step by Step Solution
There are 3 Steps involved in it
1 Expert Approved Answer
Step: 1 Unlock

Question Has Been Solved by an Expert!
Get step-by-step solutions from verified subject matter experts
Step: 2 Unlock
Step: 3 Unlock