

Question: The graph below shows monthly data collected on facilities maintenance department year 50,000 WEE 45000 49,000 35.000 30.000 Maintenance Department Costs 25.000 30,000 15.000 10,000
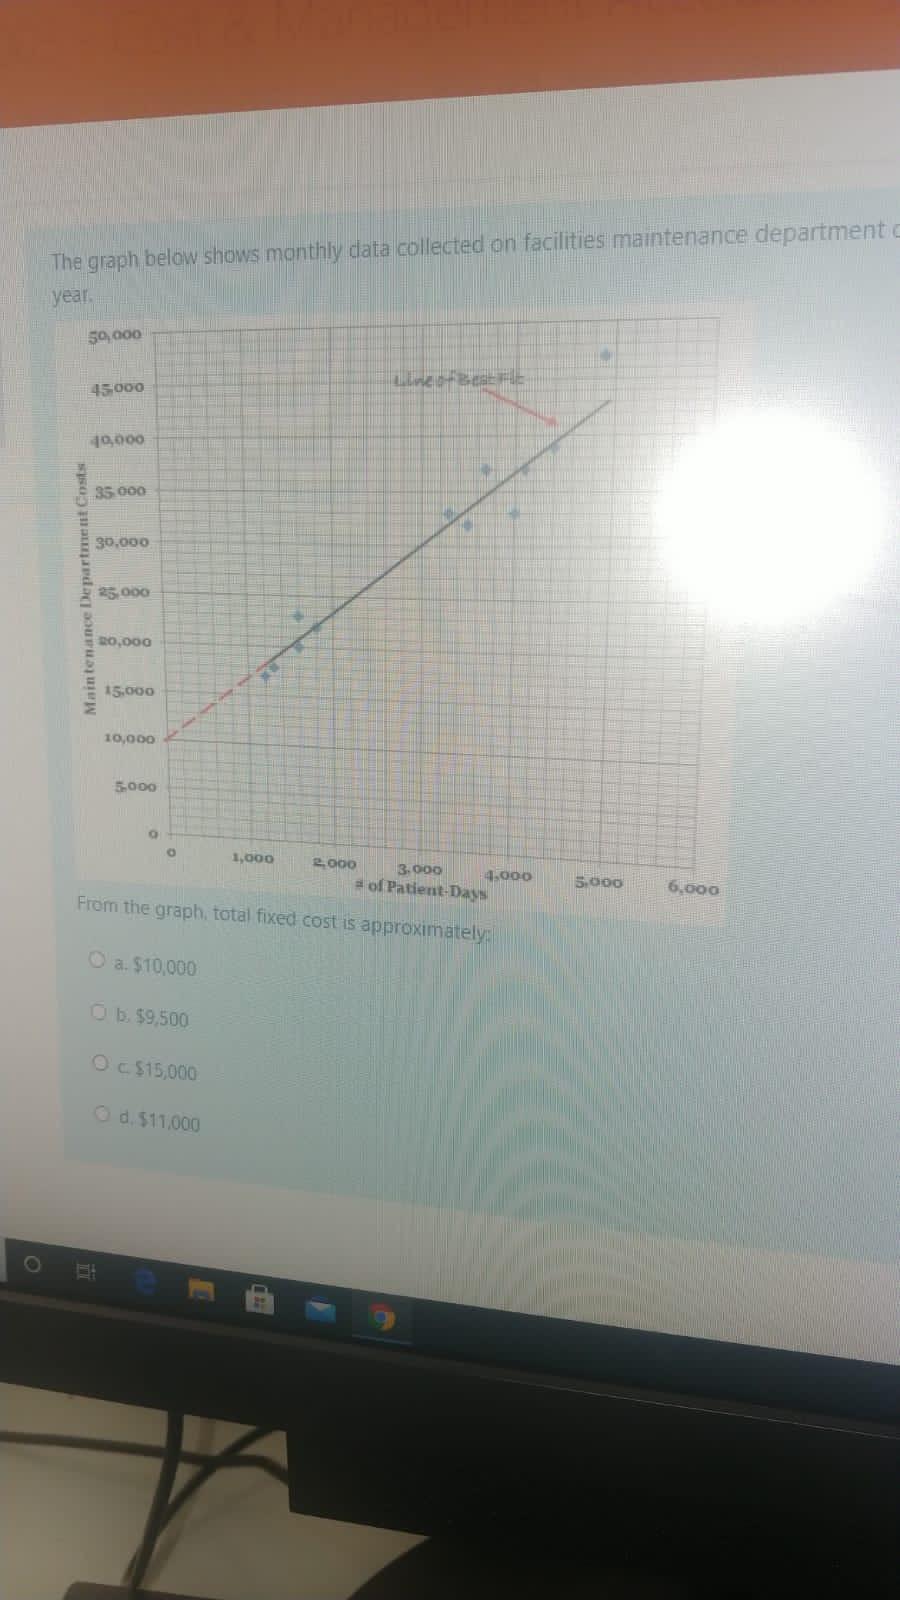
The graph below shows monthly data collected on facilities maintenance department year 50,000 WEE 45000 49,000 35.000 30.000 Maintenance Department Costs 25.000 30,000 15.000 10,000 5.000 1,000 2.000 3,000 of Patient-Days 4.000 5.000 6,000 From the graph total fixed cost is approximately O a $10,000 b. $9,500 O.C$15,000 d. 511,000
Step by Step Solution
There are 3 Steps involved in it
1 Expert Approved Answer
Step: 1 Unlock

Question Has Been Solved by an Expert!
Get step-by-step solutions from verified subject matter experts
Step: 2 Unlock
Step: 3 Unlock