

Question: The graph below shows monthly data collected on facilities maintenance didepartment costs and on the number of patient-days serviced over the past year. The cost
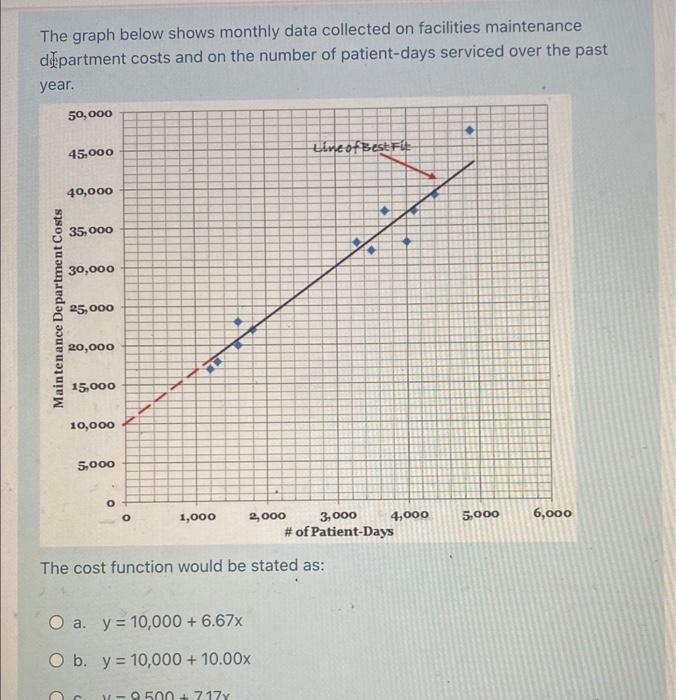
The graph below shows monthly data collected on facilities maintenance didepartment costs and on the number of patient-days serviced over the past year. The cost function would be stated as: a. y=10,000+6.67x b. y=10,000+10.00x
Step by Step Solution
There are 3 Steps involved in it
1 Expert Approved Answer
Step: 1 Unlock

Question Has Been Solved by an Expert!
Get step-by-step solutions from verified subject matter experts
Step: 2 Unlock
Step: 3 Unlock