

Question: Part III: Analyzing the Data (25 points) Instructions: Build a query that will mimic the chart provide (reproduced below). You will need to create formula:

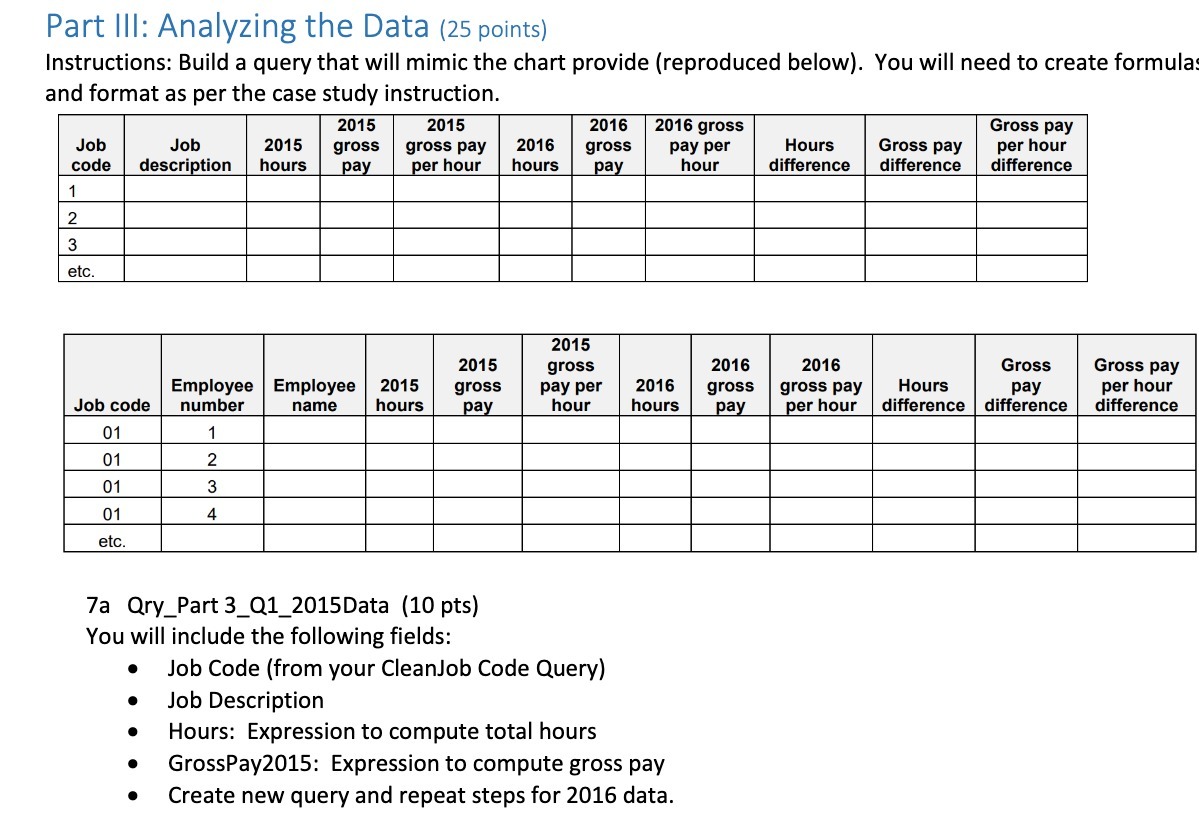
Part III: Analyzing the Data (25 points) Instructions: Build a query that will mimic the chart provide (reproduced below). You will need to create formula: and format as per the case study instruction. 2015 2015 2016 2016 gross Gross pay Job Job 2015 gross gross pay 2016 gross pay per Hours Gross pay per hour code description hours pay per hour hours pay hour difference difference difference 3 etc 2015 2015 gross 2016 2016 Gross Gross pay Employee Employee 2015 gross pay per 2016 gross gross pay Hours pay per hour Job code number name hours pay hour hours pay per hour difference difference difference 01 01 2 01 3 01 4 etc. 7a Qry_Part 3_Q1_2015Data (10 pts) You will include the following fields: Job Code (from your CleanJob Code Query) Job Description . Hours: Expression to compute total hours GrossPay2015: Expression to compute gross pay . Create new query and repeat steps for 2016 data
Step by Step Solution
There are 3 Steps involved in it

Get step-by-step solutions from verified subject matter experts