

Question: Part three: The graph to the right portrays the decision criterion for a hypothesis test for a population mean u. The null hypothesis for the
Part three:
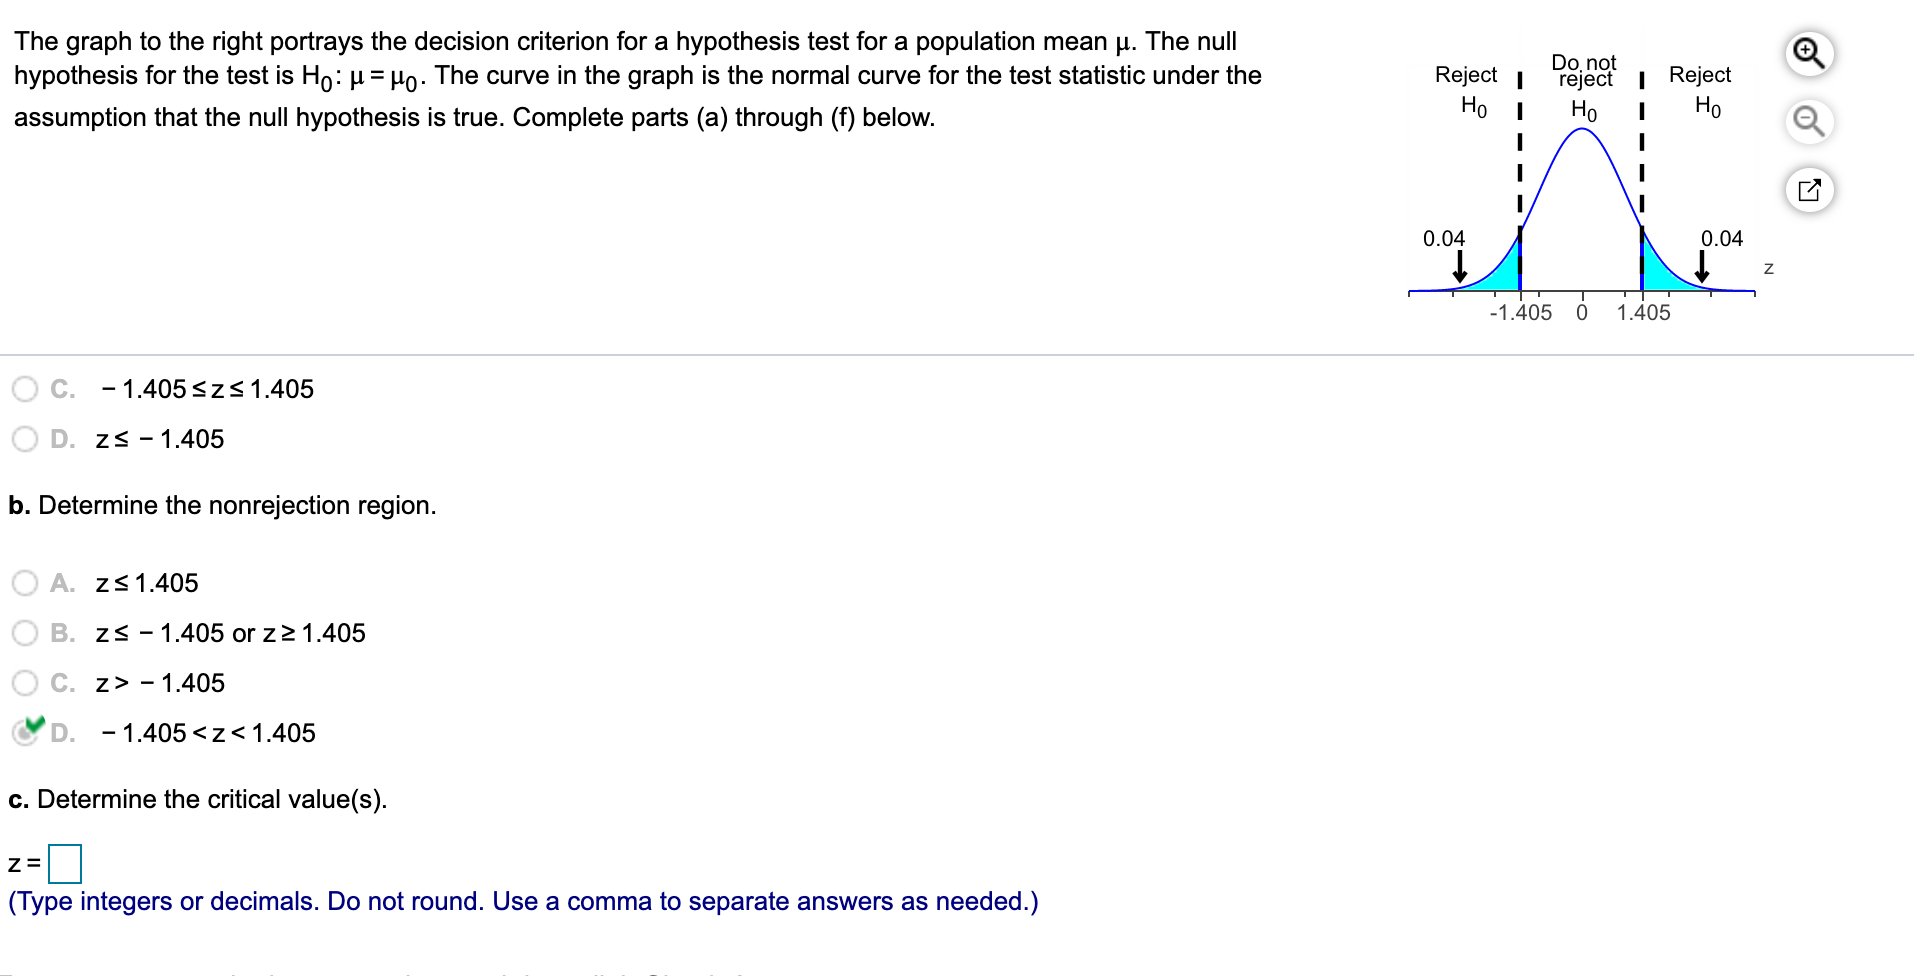
The graph to the right portrays the decision criterion for a hypothesis test for a population mean u. The null hypothesis for the test is H0: [1. = H). The curve in the graph is the normal curve for the test statistic under the Reject Do "0' reject assumption that the null hypothesis is true. Complete parts (a) through (f) below. -1.405 0 1.405 C. -1.405$zS1.4D5 D. ZS -1.405 b. Determine the nonrejection region. A. 251.405 B. zS-1.4050rzz1.405 C. z>-1.405 ~VD. -1.405
Step by Step Solution
There are 3 Steps involved in it
1 Expert Approved Answer
Step: 1 Unlock

Question Has Been Solved by an Expert!
Get step-by-step solutions from verified subject matter experts
Step: 2 Unlock
Step: 3 Unlock