

Question: The graph portrays the decision criterion for a hypothesis test for a population mean. The null hypothesis is HoHo. The curve is the normal curve
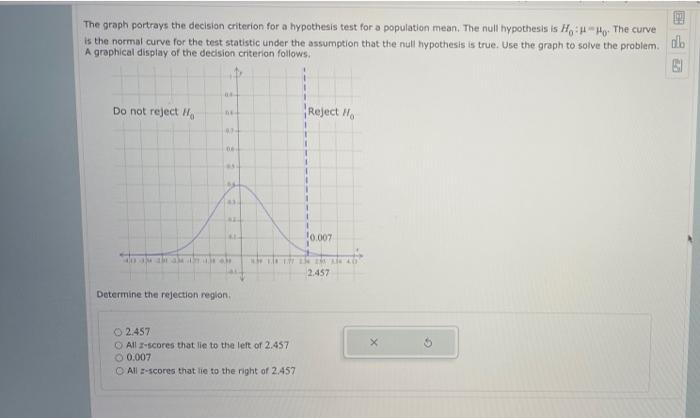
The graph portrays the decision criterion for a hypothesis test for a population mean. The null hypothesis is HoHo. The curve is the normal curve for the test statistic under the assumption that the null hypothesis is true. Use the graph to solve the problem. db A graphical display of the decision criterion follows. Do not reject 1 Reject 1 1 1 1 1 10.007 Na 2.457 Determine the rejection region 2.457 All-scores that lie to the left of 2.457 0.007 O All-scores that lie to the right of 2.457
Step by Step Solution
There are 3 Steps involved in it
1 Expert Approved Answer
Step: 1 Unlock

Question Has Been Solved by an Expert!
Get step-by-step solutions from verified subject matter experts
Step: 2 Unlock
Step: 3 Unlock