

Question: Partial Excel output from another random sample of 10 observations Coefficients Standard Error t Stat P-value Lower 95% Upper 95% Intercept 9.795 3.508 Number of
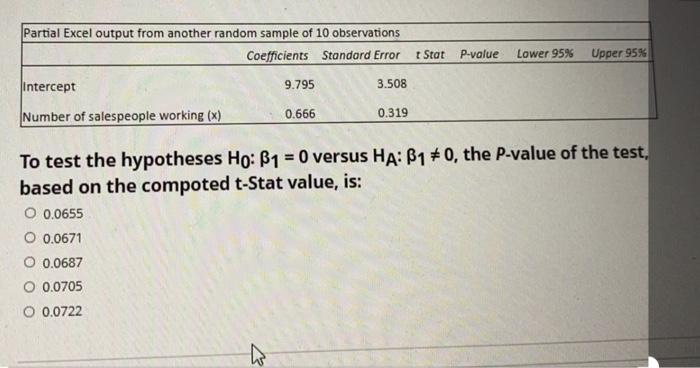
Partial Excel output from another random sample of 10 observations Coefficients Standard Error t Stat P-value Lower 95% Upper 95% Intercept 9.795 3.508 Number of salespeople working (x) 0.666 0.319 To test the hypotheses Ho: B1 = 0 versus HA: B1 * 0, the P-value of the test, based on the compoted t-Stat value, is: O 0.0655 O 0.0671 O 0.0687 0.0705 O 0.0722
Step by Step Solution
There are 3 Steps involved in it
1 Expert Approved Answer
Step: 1 Unlock

Question Has Been Solved by an Expert!
Get step-by-step solutions from verified subject matter experts
Step: 2 Unlock
Step: 3 Unlock