

Question: Paste below a screen capture of your simulation waveforms covering all input combinations. Choose a time scale appropriate to show the results recorded in the
Paste below a screen capture of your simulation waveforms covering all input combinations. Choose a time scale appropriate to show the results recorded in the truth table above. To help ensure that each student has done their own design and simulations, it is expected that the waveform colors and marker positions should be unique for each student.
Paste below the code you wrote in your Verilog circuit module.
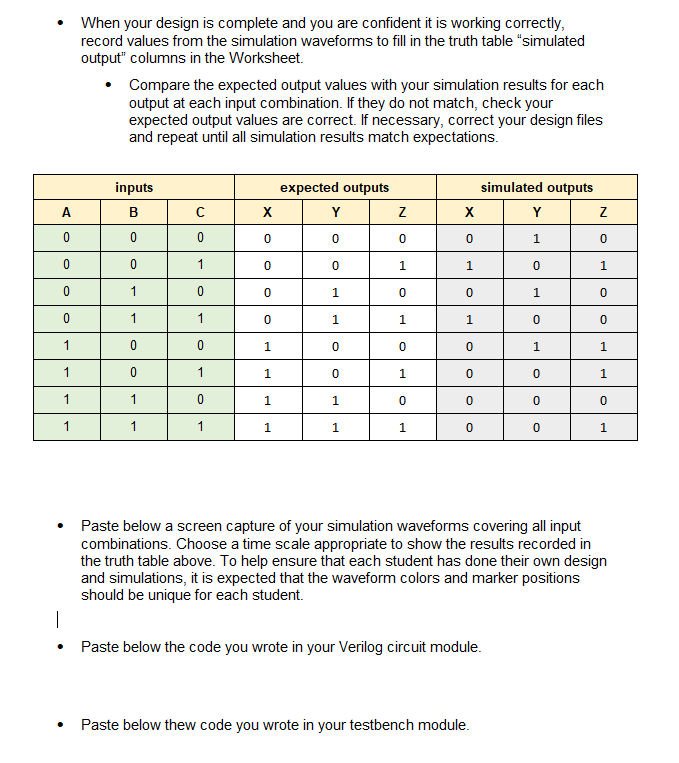
Paste below thew code you wrote in your testbench module When your design is complete and you are confident it is working correctly, record values from the simulation waveforms to fill in the truth table "simulated output" columns in the Worksheet.
Compare the expected output values with your simulation results for each output at each input combination. If they do not match, check your expected output values are correct. If necessary, correct your design files and repeat until all simulation results match expectations.
Paste below a screen capture of your simulation waveforms covering all input combinations. Choose a time scale appropriate to show the results recorded in the truth table above. To help ensure that each student has done their own design and simulations, it is expected that the waveform colors and marker positions should be unique for each student.
Paste below the code you wrote in your Verilog circuit module.
Paste below thew code you wrote in your testbench module.
Step by Step Solution
There are 3 Steps involved in it
1 Expert Approved Answer
Step: 1 Unlock

Question Has Been Solved by an Expert!
Get step-by-step solutions from verified subject matter experts
Step: 2 Unlock
Step: 3 Unlock