

Question: Peak Power 2-2 Estimate an appropriate regression equation to predict the peak power load for this power company. Interpret the estimated regression coefficients. 2-3 Analyze
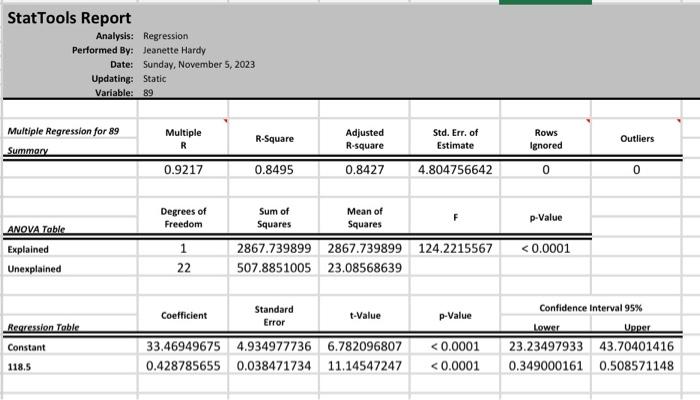
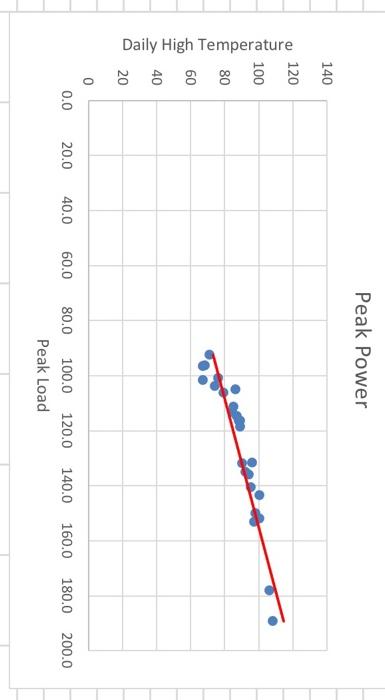
Peak Power 2-2 Estimate an appropriate regression equation to predict the peak power load for this power company. Interpret the estimated regression coefficients. 2-3 Analyze the estimated equation's residuals. Do they suggest that the regression equation is adequate? What actions could you take to improve the quality of th model? (Keep in mind that in simple regression you only have two variables - i.v. and d., v- so, you can't take out any variables as you can in multiple regression. So, you need to examine the scatterplot, look at the spread of the observations, and perhaps decide if removing any observations might be a way to improve things.) 2-4 Use your final equation to predict the peak power load on a summer day with a high temperature of 100 degrees. 2-5 Using the scatterplot, comment on the observed relationship between X and Y. StatTools Report Analysis: Performed By: Jeanette Hardy Date: Sunday, November 5, 2023 Updating: Static Variable: 89 \begin{tabular}{|c|c|c|c|c|c|c|} \hline Multiple Regression for 89 & \multirow{2}{*}{\begin{tabular}{c} Multiple \\ R \end{tabular}} & \multirow{2}{*}{ R-Square } & \multirow{2}{*}{\begin{tabular}{l} Adjusted \\ R-square \end{tabular}} & \multirow{2}{*}{\begin{tabular}{c} Std. Err. of \\ Estimate \end{tabular}} & \multirow{2}{*}{\begin{tabular}{c} Rows \\ Ignored \end{tabular}} & \multirow{2}{*}{ Outliers } \\ \hline Summery & & & & & & \\ \hline & 0.9217 & 0.8495 & 0.8427 & 4.804756642 & 0 & 0 \\ \hline ANOVA Table & \begin{tabular}{c} Degrees of \\ Freedom \end{tabular} & \begin{tabular}{l} Sum of \\ Squares \end{tabular} & \begin{tabular}{l} Mean of \\ Squares \end{tabular} & F & p-Value & \\ \hline Explained & 1 & 2867.739899 & 2867.739899 & 124.2215567 &
Step by Step Solution
There are 3 Steps involved in it

Get step-by-step solutions from verified subject matter experts