

Question: People Analytics Instructions You can use any material you answer both questions. Limit your answers to 500 words each. Answers need to be emailed to
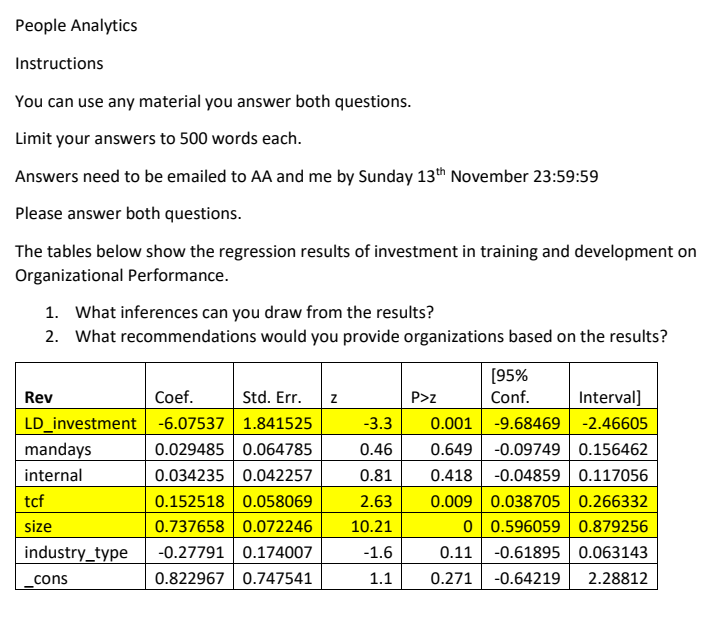
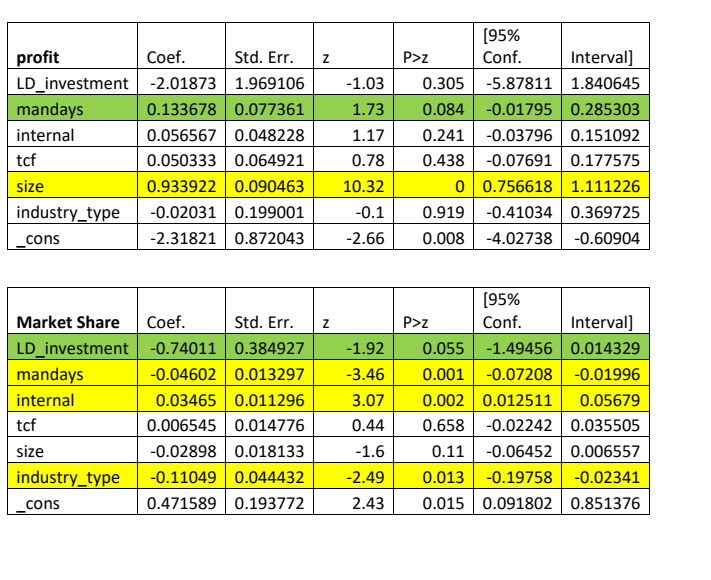
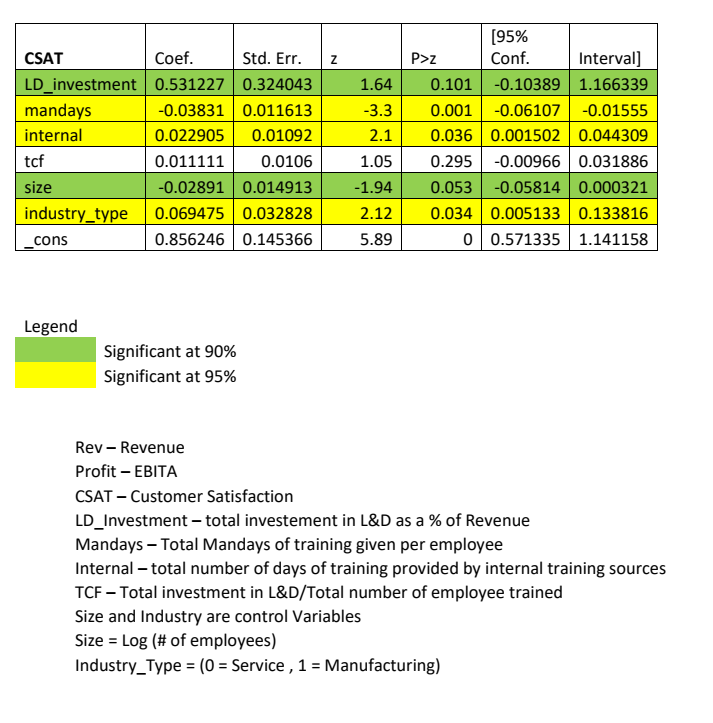
People Analytics Instructions You can use any material you answer both questions. Limit your answers to 500 words each. Answers need to be emailed to AA and me by Sunday 13th November 23:59:59 Please answer both questions. The tables below show the regression results of investment in training and development on Organizational Performance. 1. What inferences can you draw from the results? 2. What recommendations would you provide organizations based on the results? [95% Coef. Std. Err. P>z Cont. Interval] LDJnvestment 46605 mandavs 0.156462 internal 0.117056 tcf 0.266332 size 0.737658 0.022246 10.21 0 0.596059 0.829256 industry_type {1.27291 0.17400? 1.6 0.11 {1.61895 0.063143 _cons 0.822967 0.247541 1.1 0.271 {1.64219 2.28812 [95% profit Coef. Std. Err. P>z Conf Interval] LD investment -2.01873 1.969106 -1.03 0.305 -5.87811 1.840645 mandays 0.133678 0.077361 1.73 0.084 -0.01795 0.285303 internal 0.056567 0.048228 1.17 0.241 -0.03796 0.151092 tcf 0.050333 0.064921 0.78 0.438 -0.07691 0.177575 size 0.933922 0.090463 10.32 0 0.756618 1.111226 industry_type -0.02031 0.199001 -0.1 0.919 -0.41034 0.369725 cons -2.31821 0.872043 -2.66 0.008 -4.02738 -0.60904 [95% Market Share Coef. Std. Err. Z P>z Conf Interval] LD_investment -0.74011 0.384927 -1.92 0.055 -1.49456 0.014329 mandays -0.04602 0.013297 -3.46 0.001 -0.07208 -0.01996 internal 0.03465 0.011296 3.07 0.002 0.012511 0.05679 tcf 0.006545 0.014776 0.44 0.658 -0.02242 0.035505 size -0.02898 0.018133 -1.6 0.11 -0.06452 0.006557 industry_type -0.11049 0.044432 -2.49 0.013 -0.19758 -0.02341 cons 0.471589 0.193772 2.43 0.015 0.091802 0.851376[95% CSAT Coef. Std. Err. Z P>z Conf. Interval] LD_investment 0.531227 0.324043 1.64 0.101 -0.10389 1.166339 mandays -0.03831 0.011613 3.3 0.001 -0.06107 -0.01555 internal 0.022905 0.01092 2.1 0.036 0.001502 0.044309 tcf 0.011111 0.0106 1.05 0.295 -0.00966 0.031886 size 0.02891 0.014913 -1.94 0.053 -0.05814 0.000321 industry_type 0.069475 0.032828 2.12 0.034 0.005133 0.133816 cons 0.856246 0.145366 5.89 0 0.571335 1.141158 Legend Significant at 90% Significant at 95% Rev - Revenue Profit - EBITA CSAT - Customer Satisfaction LD_Investment - total investement in L&D as a % of Revenue Mandays - Total Mandays of training given per employee Internal - total number of days of training provided by internal training sources TCF - Total investment in L&D/Total number of employee trained Size and Industry are control Variables Size = Log (# of employees) Industry_Type = (0 = Service , 1 = Manufacturing)
Step by Step Solution
There are 3 Steps involved in it

Get step-by-step solutions from verified subject matter experts