

Question: Perform a financial analysis for a project using the format provided in Figure 1. Assume that the projected costs and benefits for this project are
Perform a financial analysis for a project using the format provided in Figure 1. Assume that the projected costs and benefits for this project are spread over four years as follows: Estimated costs are $400,000 in Year 0 and $50,000 each year in Years 1, 2, and 3. Estimated benefits are $0 in Year 0 and $180,000 each year in Years 1, 2, and 3. Use a 10 percent discount rate, and round the discount factors to two decimal places. Create a spreadsheet to calculate and clearly display the NPV, ROI, and year in which payback occurs. Do not discount the cost and benefit in Year 0. The discount costs and benefits must start from Year 1. Would you recommend investing in this project?
Figure 1:
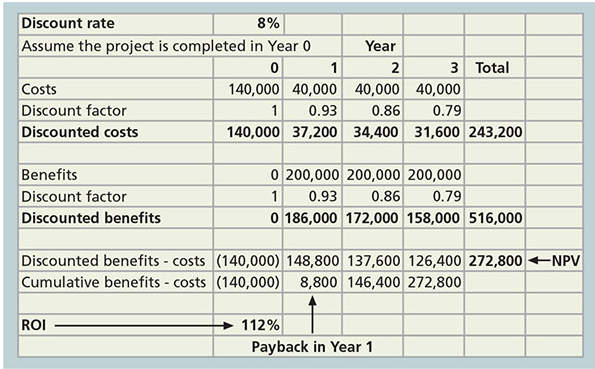
Discount rate 8% Assume the project is completed in Year 0 Year 0 1 2 3 Total Costs 140,000 40,000 40,000 40,000 Discount factor 1 0.93 0.86 0.79 Discounted costs 140,000 37,200 34,400 31,600 243,200 Benefits Discount factor Discounted benefits 0 200,000 200,000 200,000 1 0.93 0.86 0.79 0 186,000 172,000 158,000 516,000 Discounted benefits - costs (140,000) 148,800 137,600 126,400 272,800 +NPV Cumulative benefits - costs (140,000) 8,800 146,400 272,800 ROI 112% Payback in Year 1 Discount rate 8% Assume the project is completed in Year 0 Year 0 1 2 3 Total Costs 140,000 40,000 40,000 40,000 Discount factor 1 0.93 0.86 0.79 Discounted costs 140,000 37,200 34,400 31,600 243,200 Benefits Discount factor Discounted benefits 0 200,000 200,000 200,000 1 0.93 0.86 0.79 0 186,000 172,000 158,000 516,000 Discounted benefits - costs (140,000) 148,800 137,600 126,400 272,800 +NPV Cumulative benefits - costs (140,000) 8,800 146,400 272,800 ROI 112% Payback in Year 1
Step by Step Solution
There are 3 Steps involved in it

Get step-by-step solutions from verified subject matter experts