

Question: Perform a linear regression where average cost is the dependent variable and where quantity and quantity squared are the explanatory variables. Use the line plot
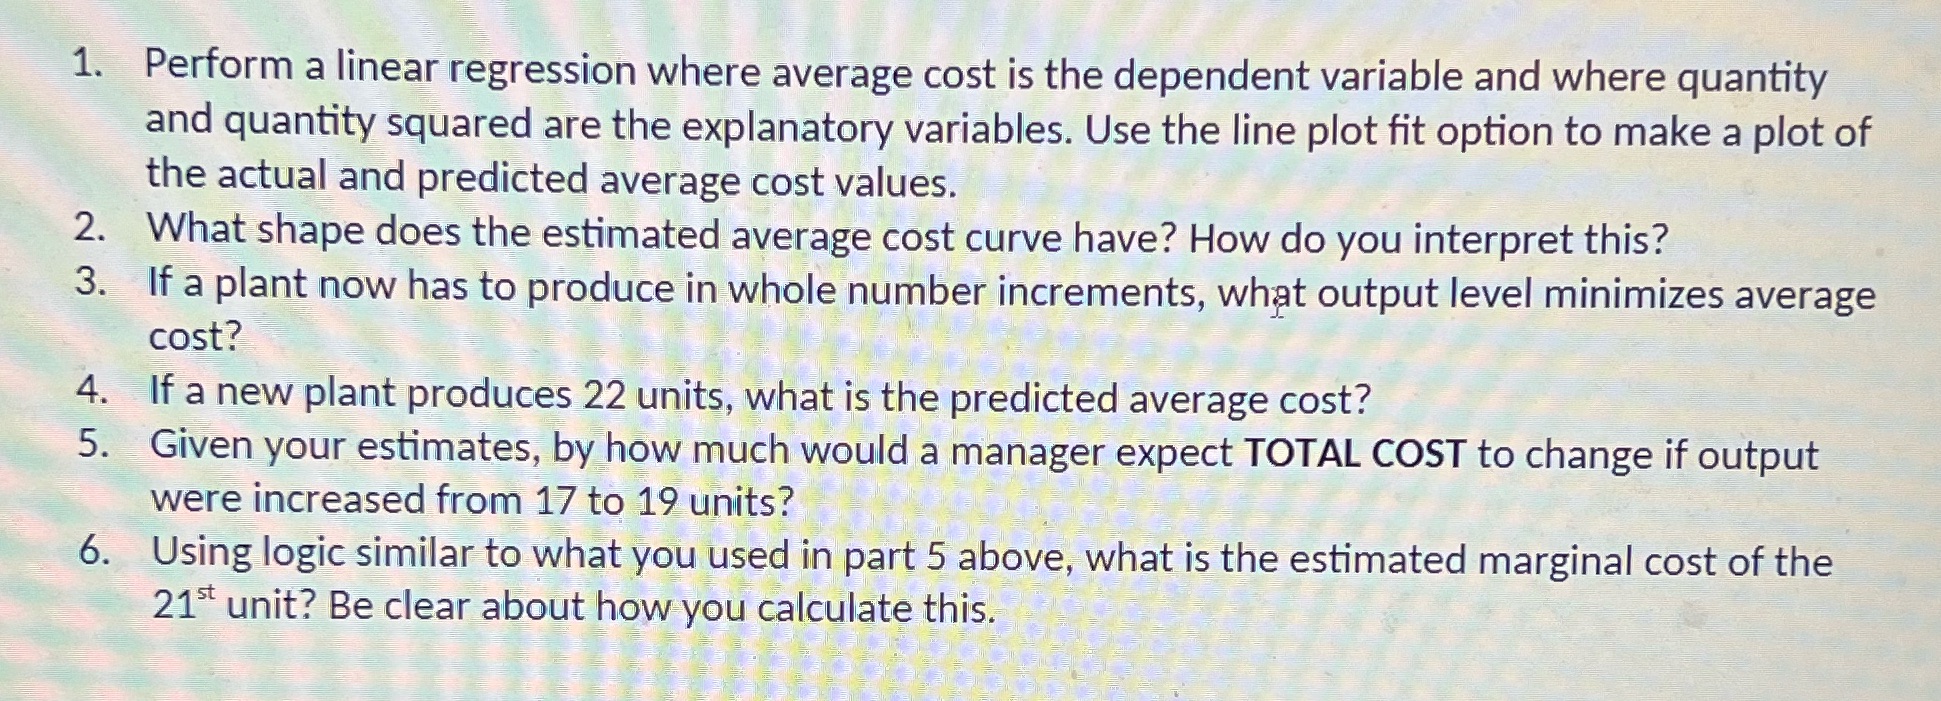
Perform a linear regression where average cost is the dependent variable and where quantity and quantity squared are the explanatory variables. Use the line plot fit option to make a plot of the actual and predicted average cost values. What shape does the estimated average cost curve have? How do you interpret this? If a plant now has to produce in whole number increments, what output level minimizes average cost? If a new plant produces 22 urt's, what is the predicted average cost? Given your estimates, by how much would a manager expect TOTAL COST to change if output were increased from 17 to 19 units? Using logic similar to what you used in part 5 abov, what is the estimated marginal cost of the 21" unit? Be clear about how you calculate this
Step by Step Solution
There are 3 Steps involved in it

Get step-by-step solutions from verified subject matter experts