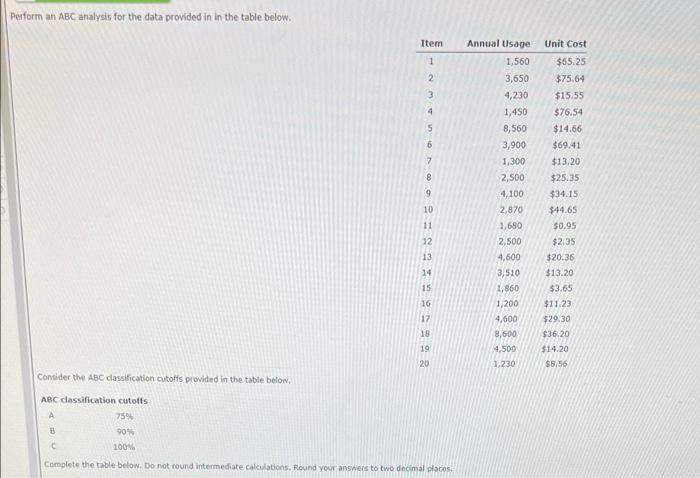
Question: Perform an ABC analysis for the data provided in in the table below. Item 1 Unit Cost $65.25 $75.64 $15.55 2 3 4 5 6

Perform an ABC analysis for the data provided in
Perform an ABC analysis for the data provided in in the table below. Item 1 Unit Cost $65.25 $75.64 $15.55 2 3 4 5 6 7 8 Annual Usage 1,560 3,650 4,230 1,450 8,560 3,900 1,300 2,500 4,100 2,870 1.680 2,500 4,600 3,510 1,860 1,200 9 10 11 12 13 $76.54 $14.66 $69.41 $13.20 $25.35 $34.15 $44.65 $0.95 $2.35 $20.36 $13.20 $3.65 $11.23 $29.30 $36.20 $14.20 $8.56 14 15 16 17 18 4,600 19 8,600 4,500 1,230 20 Consider the ABC dassification cutoffs provided in the table below, ABC classification cutolls A 759 3 90% C 100% Complete the table below. Do not round intermediate calculations. Round your answers to two decimal places Projected Dollar Usage Annual Cumulative Dollar Usage Cumulative Percent of Total Cumulative Percent Item ABC Classification of Items -Select- $ $ % -Select- -Select- $ $ % % -Select- -Select $ 9% % -Select -Select $ % % -Select- -Select- $ $ % 9 -Select- -Select $ 98 % Select- -Select- $ 96 Select Select $ % -Select- Select $ -Select Select 96 % -Select- 4. Select % Select % -Select Select $ Select Select $ 99 Select Select $ % Select -Select 5 96 -Select 96 -Select- -Select- -Select $ -Select- -Select * * -Select -Select- $ $ 9 Select

Step by Step Solution

There are 3 Steps involved in it

1 Expert Approved Answer
Step: 1 Unlock blur-text-image
Question Has Been Solved by an Expert!

Get step-by-step solutions from verified subject matter experts

Step: 2 Unlock
Step: 3 Unlock

Students Have Also Explored These Related General Management Questions!