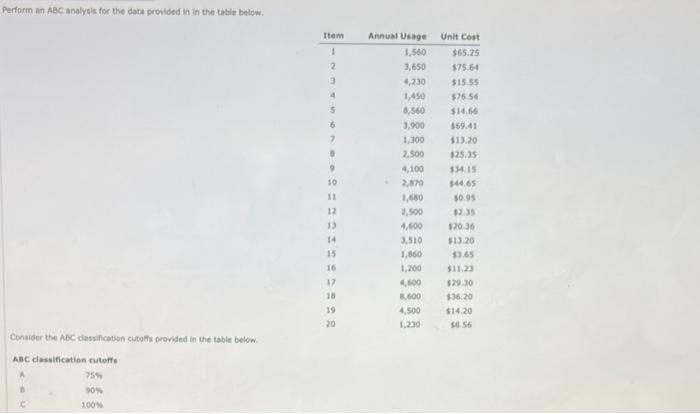
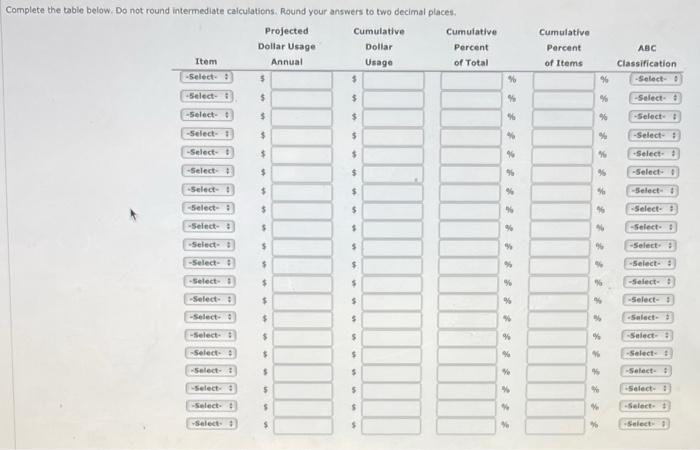
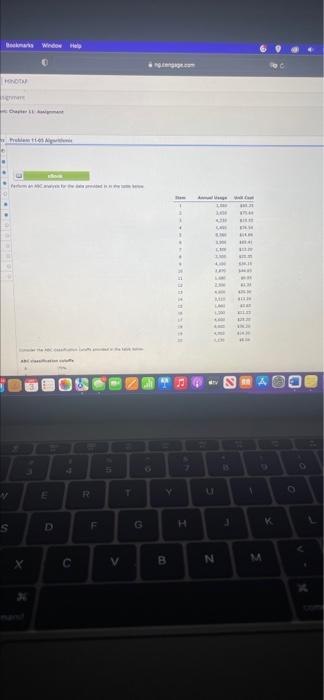
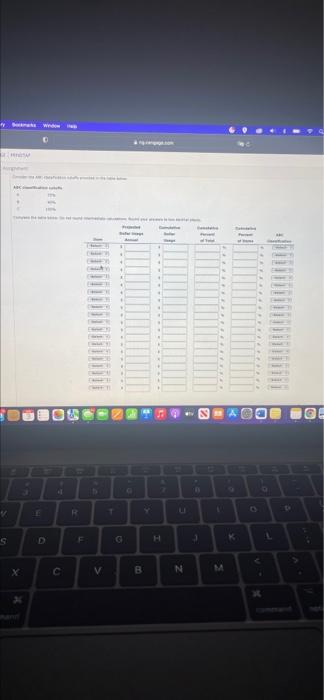
Question: Perform an ABC analysis for the data provided in in the table below. Item 1 2 3 4 5 6 7 . 9 10 Annual

Perform an ABC analysis for the data provided in
Perform an ABC analysis for the data provided in in the table below. Item 1 2 3 4 5 6 7 . 9 10 Annual Usage 1,560 3,650 4,230 1,450 1,560 3,900 1,300 2.500 4,100 2,670 1.680 2,500 4,600 3,510 1,860 1.200 4.600 3.600 4,500 1.230 Unit Cost 365.25 17564 $15.95 $7654 $14.66 $69.41 $13.20 125.35 15 34465 $0.95 3235 $20.36 $13.20 $3.65 $11.23 529 30 $36.20 $14.20 3856 12 13 14 15 16 17 18 19 20 Consider the MBC classification cutoffe provided in the table below ABC Cassification cutomne 75 90% 100% Complete the table below. Do not round Intermediate calculations. Round your answers to two decimal places Projected Cumulative Cumulative Dollar Usage Dollar Percent Item Annual Usage of Total Select 5 $ -Select- $ $ Cumulative Percent of Items ABC Classification -Select- % % % % -Select- -Select- $ $ % % -Select -Select ! $ $ % -Select- Select -Select $ $ 96 % Select $ $ 9 95 -Select- -Select $ $ % % -Select $ 5 96 46 -Select- Select -Select- $ $ % -Select Select $ $ % 9 -Select $ $ % -Select -Select- -Select- Select $ s % -Select $ $ -Select- : Select $ $ % -Select- -Select- -Select $ $ % % Select $ $ % Select + -Select- $ $ Select 5 5 Select Select $ $ 4 -Select Select $ $ mas Window Hello NON A V 1 E R S D F G . C c X V B. N. R D F G H K X V B N

Step by Step Solution

There are 3 Steps involved in it

1 Expert Approved Answer
Step: 1 Unlock blur-text-image
Question Has Been Solved by an Expert!

Get step-by-step solutions from verified subject matter experts

Step: 2 Unlock
Step: 3 Unlock

Students Have Also Explored These Related General Management Questions!