

Question: PLE PLEASE HELP! Part B: Labor and Workload Analysis (30 pts) - Perform basic budgeting tasks for this healthcare organization. *** Goldenview's New Service Line
 PLE
PLE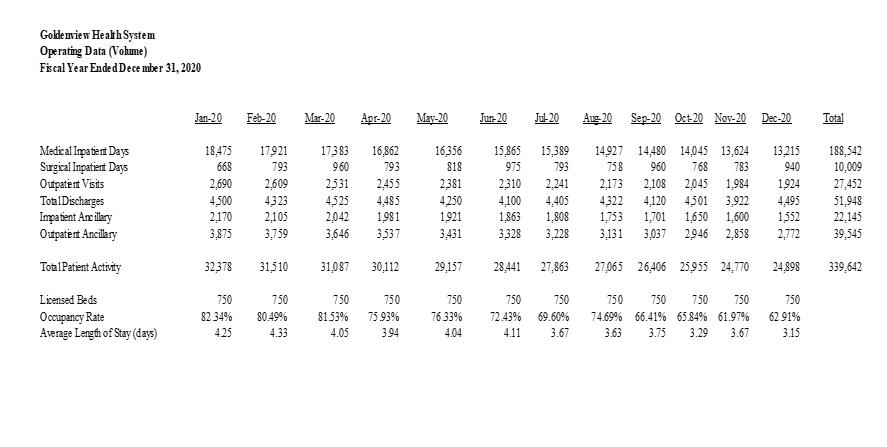
PLEASE HELP!
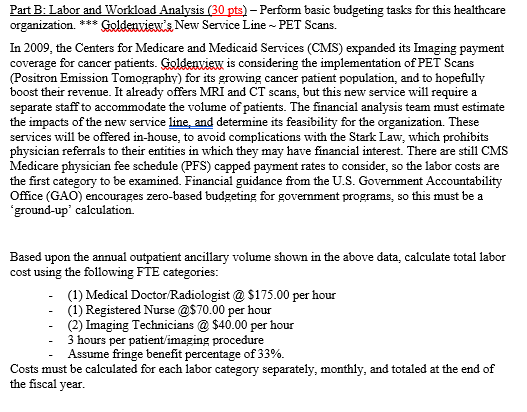
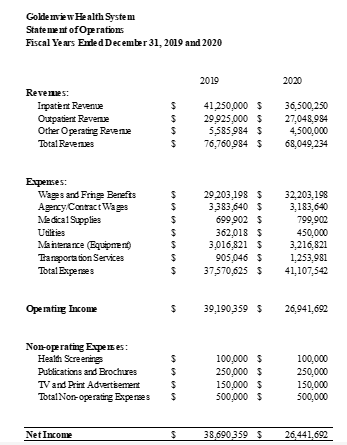
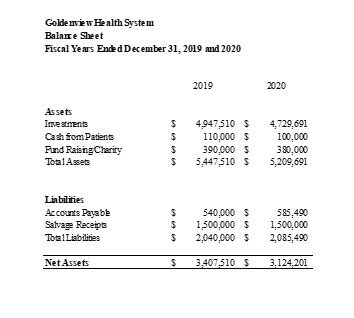
Part B: Labor and Workload Analysis (30 pts) - Perform basic budgeting tasks for this healthcare organization. *** Goldenview's New Service Line ~ PET Scans. In 2009, the Centers for Medicare and Medicaid Services (CMS) expanded its Imaging payment coverage for cancer patients. Goldenview is considering the implementation of PET Scans (Positron Emission Tomography) for its growing cancer patient population, and to hopefully boost their revenue. It already offers MRI and CT scans, but this new service will require a separate staff to accommodate the volume of patients. The financial analysis team must estimate the impacts of the new service line, and determine its feasibility for the organization. These services will be offered in-house, to avoid complications with the Stark Law, which prohibits physician referrals to their entities in which they may have financial interest. There are still CMS Medicare physician fee schedule (PFS) capped payment rates to consider, so the labor costs are the first category to be examined. Financial guidance from the U.S. Government Accountability Office (GAO) encourages zero-based budgeting for government programs, so this must be a 'ground-up' calculation. Based upon the annual outpatient ancillary volume shown in the above data, calculate total labor cost using the following FTE categories: (1) Medical Doctor/Radiologist @ $175.00 per hour (1) Registered Nurse @$70.00 per hour (2) Imaging Technicians @ $40.00 per hour 3 hours per patient/imaging procedure Assume fringe benefit percentage of 33%. Costs must be calculated for each labor category separately, monthly, and totaled at the end of the fiscal year. Goldenview Health System Statement of Operations Fiscal Years Ended December 31, 2019 and 2020 Revemes: Inpatient Revenue Outpatient Revenue Other Operating Revenue Total Revenues Expenses: Wages and Fringe Benefits Agency/Contract Wages Medical Supplies Utilities Maintenance (Equipment) Transportation Services Total Expenses Operating Income Non-operating Expenses: Health Screenings SSSS Net Income $ $ $ $ $ $ $ 6 $ Publications and Brochures $ TV and Print Advertisement $ Total Non-operating Expenses $ 2019 41,250,000 $ 29,925,000 $ 5,585,984 $ 76,760,984 $ 29,203,198 $ 3,383,640 $ 699,902 $ 362,018 $ 3,016,821 $ 905,046 $ 37,570,625 $ 39,190,359 $ 100,000 $ 250,000 $ 150,000 $ 500,000 $ 38,690,359 $ 2020 36,500,250 27,048,984 4,500,000 68,049,234 32,203,198 3,183,640 799,902 450,000 3,216,821 1,253,981 41,107,542 26,941,692 100,000 250,000 150,000 500,000 26,441,692 Goldenview Health System Balance Sheet Fiscal Years Ended December 31, 2019 and 2020 Assets Investments Cash from Patients Fund Raising Charity Total Assets Liabilities Accounts Payabl Salvage Receipts Total Liabilities Net Assets $ $ $ $ $ $ 14 $ 2019 4,947,510 $ 110,000 $ 390,000 $ 5,447,510 $ 540,000 $ 1,500,000 $ 2,040,000 $ 3,407,510 $ 2020 4,729,691 100,000 380,000 5,209,691 585,490 1,500,000 2,085,490 3,124,201 Goldenview Health System Operating Data (Vohume) Fiscal Year Ended December 31, 2020 Medical Inpatient Days Surgical Inpatient Days Outpatient Visits Total Discharges Impatient Ancillary Outpatient Ancillary Total Patient Activity Licensed Beds Occupancy Rate Average Length of Stay (days) Jan-20 18,475 668 2,690 4,500 2,170 3,875 32,378 750 82 34% 4.25 Feb-20 17,921 17383 16,862 793 960 793 2,609 4323 2,105 3,759 31510 750 80.49% Mar-20 Apr-20 May-20 4.33 2531 2,455 4,525 4,485 2,042 1981 3,646 3,537 31,087 30,112 750 81.53% 4.05 750 75.93% 3.94 16356 818 2381 4,250 1,921 3,431 29,157 750 76 33% 4.04 Jun-20 Jul-20 15,389 793 2310 2,241 4,100 4,405 1,863 1,808 3,328 3,228 28,441 27,863 15,865 975 750 750 72.43% 69.60% 4.11 3.67 Aug-20 Sep-20 Oct-20 Nov-20 Dec-20 940 14,927 14,480 14,045 13,624 13,215 758 960 768 783 2,173 2,108 2,045 1,984 4322 4,120 4501 3,922 1,924 4,495 1,552 1,753 3,131 1,701 1,650 1,600 3,037 2946 2,858 2,772 27,065 26,406 25,955 24,770 24,898 750 750 750 750 74.69% 66.41% 65.84% 61.97% 3.63 3.75 3.29 3.67 750 62.91% 3.15 Total 188,542 10,009 27,452 51,948 22,145 39.545 339,642 Part B: Labor and Workload Analysis (30 pts) - Perform basic budgeting tasks for this healthcare organization. *** Goldenview's New Service Line ~ PET Scans. In 2009, the Centers for Medicare and Medicaid Services (CMS) expanded its Imaging payment coverage for cancer patients. Goldenview is considering the implementation of PET Scans (Positron Emission Tomography) for its growing cancer patient population, and to hopefully boost their revenue. It already offers MRI and CT scans, but this new service will require a separate staff to accommodate the volume of patients. The financial analysis team must estimate the impacts of the new service line, and determine its feasibility for the organization. These services will be offered in-house, to avoid complications with the Stark Law, which prohibits physician referrals to their entities in which they may have financial interest. There are still CMS Medicare physician fee schedule (PFS) capped payment rates to consider, so the labor costs are the first category to be examined. Financial guidance from the U.S. Government Accountability Office (GAO) encourages zero-based budgeting for government programs, so this must be a 'ground-up' calculation. Based upon the annual outpatient ancillary volume shown in the above data, calculate total labor cost using the following FTE categories: (1) Medical Doctor/Radiologist @ $175.00 per hour (1) Registered Nurse @$70.00 per hour (2) Imaging Technicians @ $40.00 per hour 3 hours per patient/imaging procedure Assume fringe benefit percentage of 33%. Costs must be calculated for each labor category separately, monthly, and totaled at the end of the fiscal year. Goldenview Health System Statement of Operations Fiscal Years Ended December 31, 2019 and 2020 Revemes: Inpatient Revenue Outpatient Revenue Other Operating Revenue Total Revenues Expenses: Wages and Fringe Benefits Agency/Contract Wages Medical Supplies Utilities Maintenance (Equipment) Transportation Services Total Expenses Operating Income Non-operating Expenses: Health Screenings SSSS Net Income $ $ $ $ $ $ $ 6 $ Publications and Brochures $ TV and Print Advertisement $ Total Non-operating Expenses $ 2019 41,250,000 $ 29,925,000 $ 5,585,984 $ 76,760,984 $ 29,203,198 $ 3,383,640 $ 699,902 $ 362,018 $ 3,016,821 $ 905,046 $ 37,570,625 $ 39,190,359 $ 100,000 $ 250,000 $ 150,000 $ 500,000 $ 38,690,359 $ 2020 36,500,250 27,048,984 4,500,000 68,049,234 32,203,198 3,183,640 799,902 450,000 3,216,821 1,253,981 41,107,542 26,941,692 100,000 250,000 150,000 500,000 26,441,692 Goldenview Health System Balance Sheet Fiscal Years Ended December 31, 2019 and 2020 Assets Investments Cash from Patients Fund Raising Charity Total Assets Liabilities Accounts Payabl Salvage Receipts Total Liabilities Net Assets $ $ $ $ $ $ 14 $ 2019 4,947,510 $ 110,000 $ 390,000 $ 5,447,510 $ 540,000 $ 1,500,000 $ 2,040,000 $ 3,407,510 $ 2020 4,729,691 100,000 380,000 5,209,691 585,490 1,500,000 2,085,490 3,124,201 Goldenview Health System Operating Data (Vohume) Fiscal Year Ended December 31, 2020 Medical Inpatient Days Surgical Inpatient Days Outpatient Visits Total Discharges Impatient Ancillary Outpatient Ancillary Total Patient Activity Licensed Beds Occupancy Rate Average Length of Stay (days) Jan-20 18,475 668 2,690 4,500 2,170 3,875 32,378 750 82 34% 4.25 Feb-20 17,921 17383 16,862 793 960 793 2,609 4323 2,105 3,759 31510 750 80.49% Mar-20 Apr-20 May-20 4.33 2531 2,455 4,525 4,485 2,042 1981 3,646 3,537 31,087 30,112 750 81.53% 4.05 750 75.93% 3.94 16356 818 2381 4,250 1,921 3,431 29,157 750 76 33% 4.04 Jun-20 Jul-20 15,389 793 2310 2,241 4,100 4,405 1,863 1,808 3,328 3,228 28,441 27,863 15,865 975 750 750 72.43% 69.60% 4.11 3.67 Aug-20 Sep-20 Oct-20 Nov-20 Dec-20 940 14,927 14,480 14,045 13,624 13,215 758 960 768 783 2,173 2,108 2,045 1,984 4322 4,120 4501 3,922 1,924 4,495 1,552 1,753 3,131 1,701 1,650 1,600 3,037 2946 2,858 2,772 27,065 26,406 25,955 24,770 24,898 750 750 750 750 74.69% 66.41% 65.84% 61.97% 3.63 3.75 3.29 3.67 750 62.91% 3.15 Total 188,542 10,009 27,452 51,948 22,145 39.545 339,642
Step by Step Solution
There are 3 Steps involved in it

Get step-by-step solutions from verified subject matter experts