

Question: Please analyze the data in the Spreadsheet 5.1 provided below and change the relevant selected input variables realistically to increase the expected return of the
Please analyze the data in the Spreadsheet 5.1 provided below and change the relevant selected input variables realistically to increase the expected return of the stock market and to decrease the risk (measured by the standard deviation) at the same time. Please remember that probabilities need to sum up to 1. Please discuss the reasoning behind your changes and the implications of your change for the forecasting ability of the altered scenario. Does your move reflect the trade-off between risk and expected return?
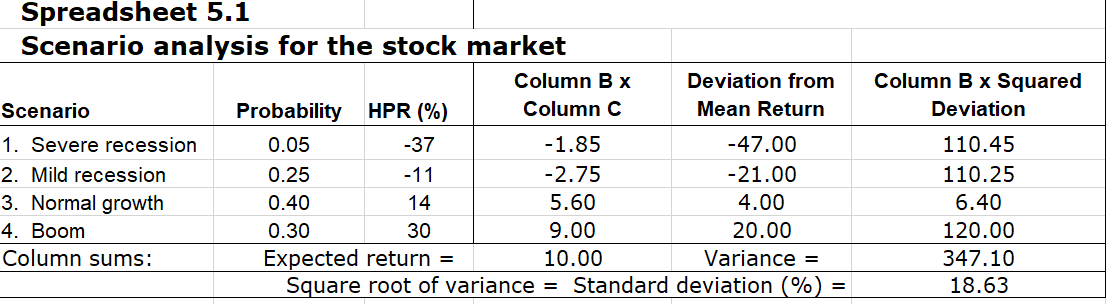
Column B x Squared Deviation Spreadsheet 5.1 Scenario analysis for the stock market Column B x Deviation from Scenario Probability HPR (%) Column C Mean Return 1. Severe recession 0.05 -37 -1.85 -47.00 2. Mild recession 0.25 -11 -2.75 -21.00 3. Normal growth 0.40 14 5.60 4.00 4. Boom 0.30 30 9.00 20.00 Column sums: Expected return = 10.00 Variance = Square root of variance = Standard deviation (%) = 110.45 110.25 6.40 120.00 347.10 18.63 Column B x Squared Deviation Spreadsheet 5.1 Scenario analysis for the stock market Column B x Deviation from Scenario Probability HPR (%) Column C Mean Return 1. Severe recession 0.05 -37 -1.85 -47.00 2. Mild recession 0.25 -11 -2.75 -21.00 3. Normal growth 0.40 14 5.60 4.00 4. Boom 0.30 30 9.00 20.00 Column sums: Expected return = 10.00 Variance = Square root of variance = Standard deviation (%) = 110.45 110.25 6.40 120.00 347.10 18.63
Step by Step Solution
There are 3 Steps involved in it

Get step-by-step solutions from verified subject matter experts