

Question: PLEASE answer 1. Using graph paper, plot a chromatogram of A595 on the left y-axis and A340 on the right y-axis (using appropriate scales) vs.
PLEASE answer
1. Using graph paper, plot a chromatogram of A595 on the left y-axis and A340 on the right y-axis (using appropriate scales) vs. elution volume on the x-axis. Indicate which fraction(s) have the highest concentration of ovalbumin. What is the elution volume for ovalbumin and what is the elution volume for NADH. INCLUDE TITLE AND LEDGEND
Reagents used:
50mM phosphate buffer in 100 mM NaCl solution pH 7
BSA 50ug/mL
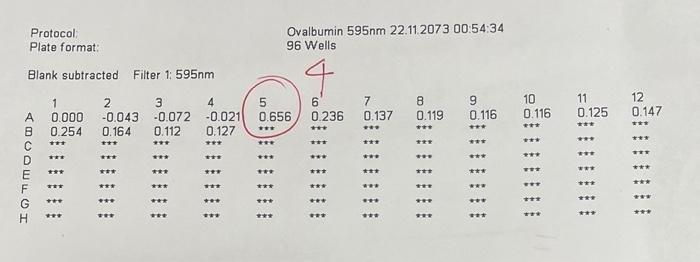
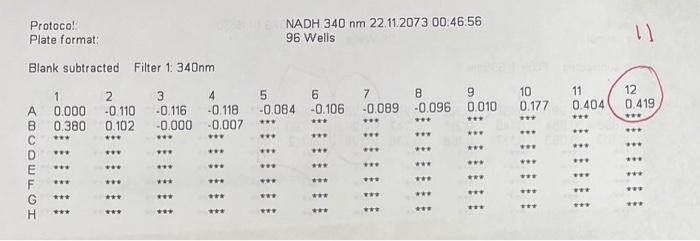
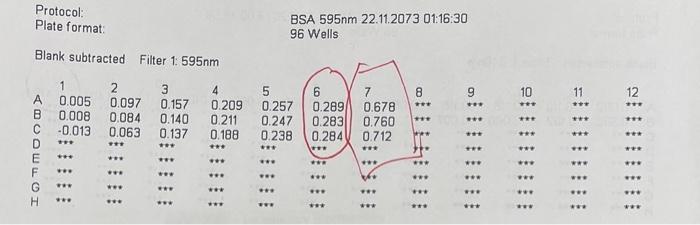
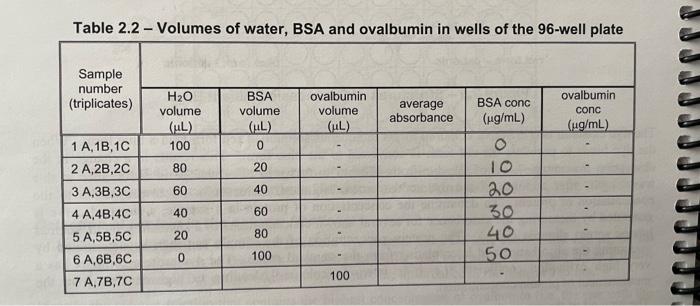
96 Wells Protoco! NADH 340nm22.11.2073 00:46:56 Plate format: 96 Wells 11 Blank subtracted Filter 1: 340nm BSA 595nm22.11.2073 01:16:30 96 Wells Table 2.2 - Volumes of water, BSA and ovalbumin in wells of the 96-well plate 96 Wells Protoco! NADH 340nm22.11.2073 00:46:56 Plate format: 96 Wells 11 Blank subtracted Filter 1: 340nm BSA 595nm22.11.2073 01:16:30 96 Wells Table 2.2 - Volumes of water, BSA and ovalbumin in wells of the 96-well plate
Step by Step Solution
There are 3 Steps involved in it

Get step-by-step solutions from verified subject matter experts