

Question: Please answer 16.12. And please explain the steps for understanding. If a language is used please use R. Thanks! 16.12. Premium distribution. A sott~drink manufacturer
Please answer 16.12. And please explain the steps for understanding. If a language is used please use R.
Thanks!
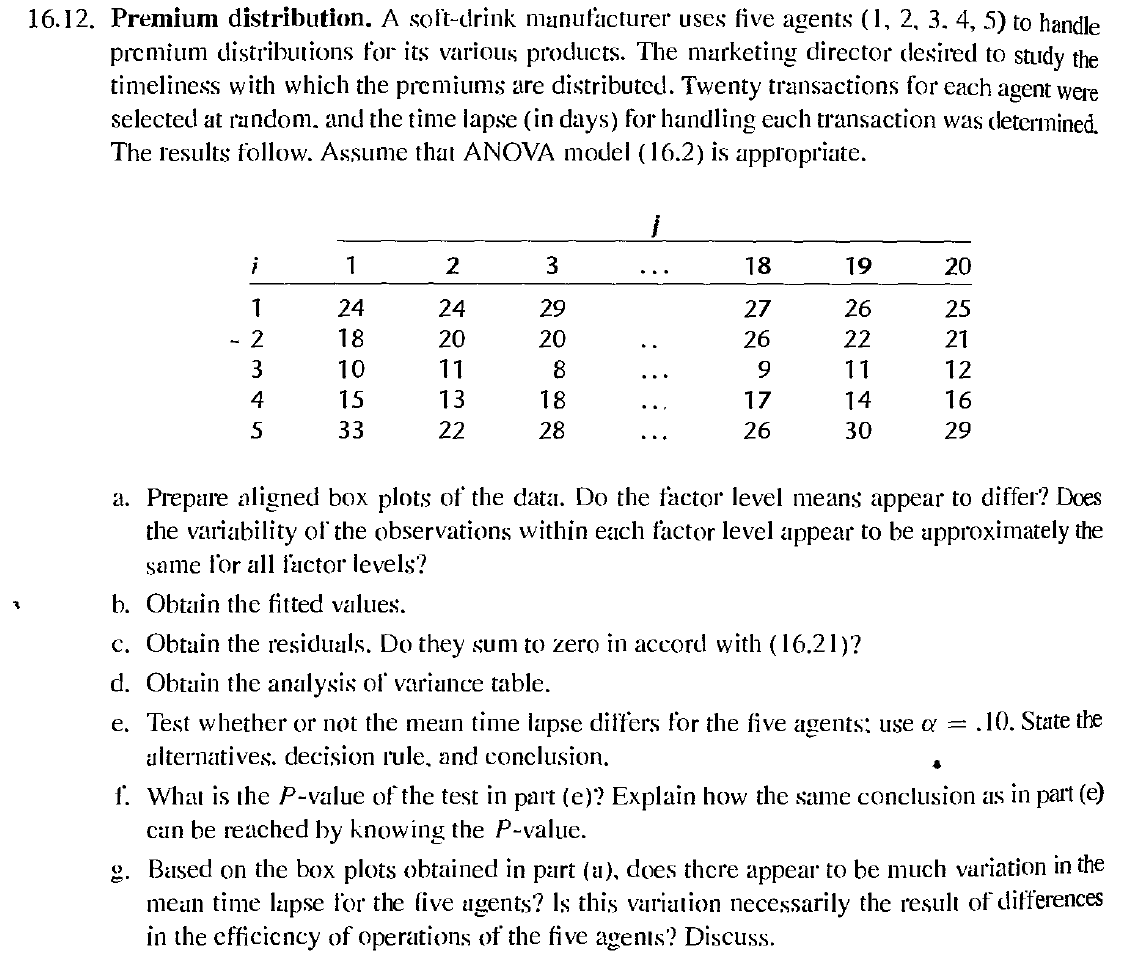

16.12. Premium distribution. A sott~drink manufacturer uses ve agents (1, 2. 3. 4, 5) to handle premium distributions for its various products. The marketing director desired to study the timeliness with which the premiums are distributed. Twenty transactions for each agent we\"; selected at random. and the time lapse (in days) for handling-r each transaction was determined The results follow. Assume that ANOVA model ( l6.2) is appropriate. {DP-PF i i 1 2 3 18 19 20 1 24 24 29 27 26 25 ~ 2 18 20 20 .. 26 22 21 3 10 11 8 9 11 12 4 15 13 18 17 14 16 5 33 22 28 26 30 29 Prepare aligned box plots of the data. Do the factor level means appear to differ? Does the variability of the observations within each factor level appear to be approximately the same lbr all factor levels? Obtain the tted values. Obtain the residuals. Do they sum to zero in accord with (16.21)? Obtain the analysis of variance table. Test whether or not the mean time lapse differs for the ve agents: use or = .10. State the alternatives. decision rule, and conclusion. , . What is the P-value ot'the test in pan (e)? Explain how the same conclusion as in part (e) can be reached by knowing. the P-value. Based on the box plots obtained in part (a), does there appear to be much variation in the mean time lapse for the live agents? Is this varialion necessarily the result of differences in the efficiency of Operations of the ve agenls'? DisCUss. 16.12. Premium distribution. A sott~drink manufacturer uses ve agents (1, 2. 3. 4, 5) to handle premium distributions for its various products. The marketing director desired to study the timeliness with which the premiums are distributed. Twenty transactions for each agent we\"; selected at random. and the time lapse (in days) for handling-r each transaction was determined The results follow. Assume that ANOVA model ( l6.2) is appropriate. {DP-PF i i 1 2 3 18 19 20 1 24 24 29 27 26 25 ~ 2 18 20 20 .. 26 22 21 3 10 11 8 9 11 12 4 15 13 18 17 14 16 5 33 22 28 26 30 29 Prepare aligned box plots of the data. Do the factor level means appear to differ? Does the variability of the observations within each factor level appear to be approximately the same lbr all factor levels? Obtain the tted values. Obtain the residuals. Do they sum to zero in accord with (16.21)? Obtain the analysis of variance table. Test whether or not the mean time lapse differs for the ve agents: use or = .10. State the alternatives. decision rule, and conclusion. , . What is the P-value ot'the test in pan (e)? Explain how the same conclusion as in part (e) can be reached by knowing. the P-value. Based on the box plots obtained in part (a), does there appear to be much variation in the mean time lapse for the live agents? Is this varialion necessarily the result of differences in the efficiency of Operations of the ve agenls'? DisCUss
Step by Step Solution
There are 3 Steps involved in it

Get step-by-step solutions from verified subject matter experts