Question: please answer 21 and 22 in excel and show steps for explanation. once correct and complete I will rate thumbs up. thank you. 21 z=

please answer 21 and 22 in excel and show steps for explanation. once correct and complete I will rate thumbs up. thank you.please answer 21 and 22 in excel and show steps

21 z= Use the data below to calculate the control limits for an Xbar chart and R chart. (Manager's step in control chart preparation) There are 11 samples with 6 in each sample. 3 1 2 3 4 5 6 7 8 9 10 X1 9.20 9.18 9.23 9.20 9.20 9.18 9.23 9.20 9.20 9.20 X2 9.28 9.28 9.24 9.22 9.24 9.28 9.28 9.24 9.28 9.23 X3 9.20 9.19 9.23 9.21 9.20 9.23 9.21 9.20 9.23 9.20 X4 9.27 9.27 9.23 9.22 9.23 9.22 9.23 9.22 9.28 9.22 X5 9.20 9.28 9.28 9.20 9.18 9.20 9.28 9.18 X6 9.26 9.20 9.28 9.28 9.20 9.28 9.19 9.23 9.22 9.24 11 9.20 9.26 9.21 9.24 9.22 9.28 9.23 9.20 UCLX LCL = UCLR LCLR= 22 AFTER you created the control chart limits as shown above, the employees in the process took samples as specified. Remember, the employees always use the control limits they are given by management. Use the control limits from above. Create a Xbar chart and a R chart graph for the data points below by inserting rows and place the charts below the three data points shown. State your conclusions for each of the samples 12 13 14 9.24 9.23 9.28 X2 9.22 9.21 9.26 X3 9.24 9.20 9.23 X 9.28 9.23 9.27 X 9.28 9.21 9.29 9.24 9.20 9.29 Xb = R- CLX- UCL, LCL- CLR- UCLR LCLR

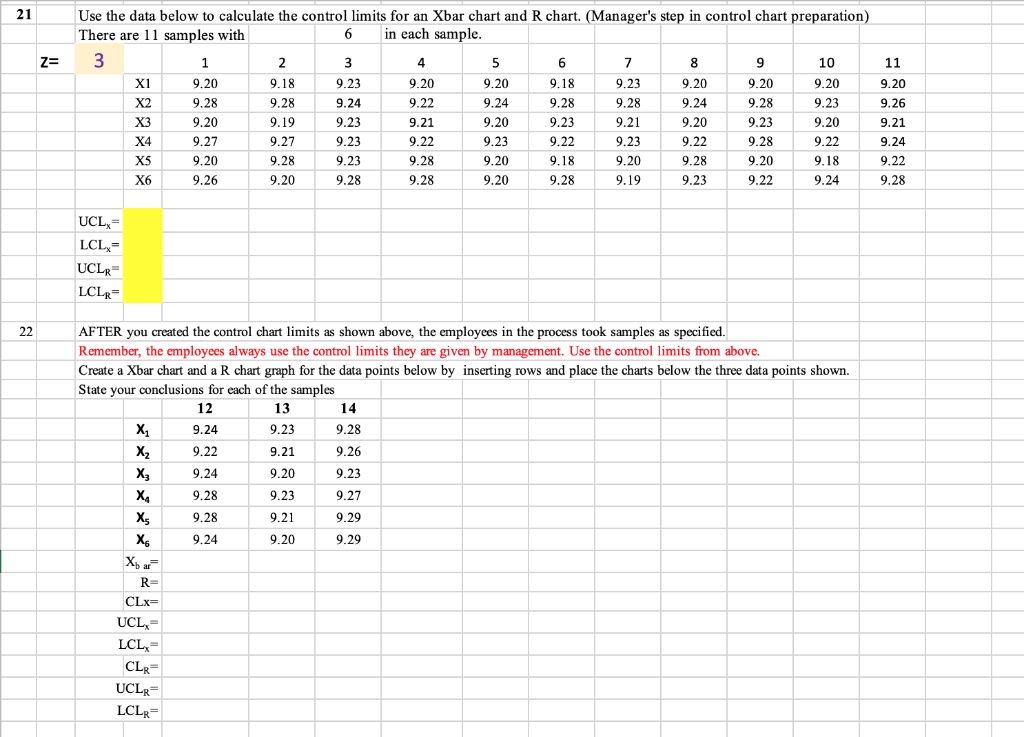
Step by Step Solution

There are 3 Steps involved in it

1 Expert Approved Answer
Step: 1 Unlock blur-text-image
Question Has Been Solved by an Expert!

Get step-by-step solutions from verified subject matter experts

Step: 2 Unlock
Step: 3 Unlock

Students Have Also Explored These Related General Management Questions!