

Question: please answer a-d (Expected return, standard deviation, and capital asset pricing model) The following are the end-of-month prices for both the Standard & Poor's 500
please answer a-d
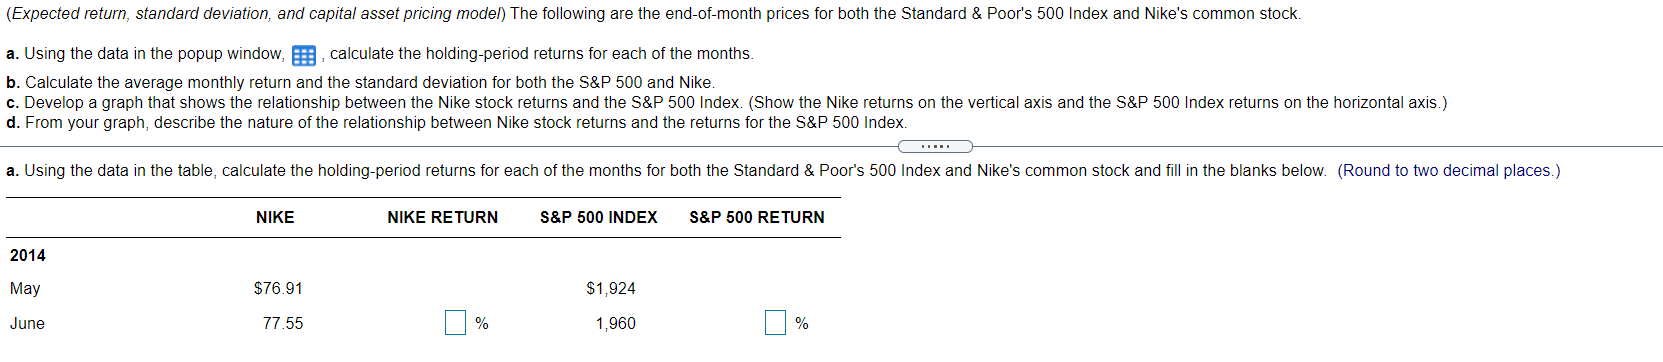
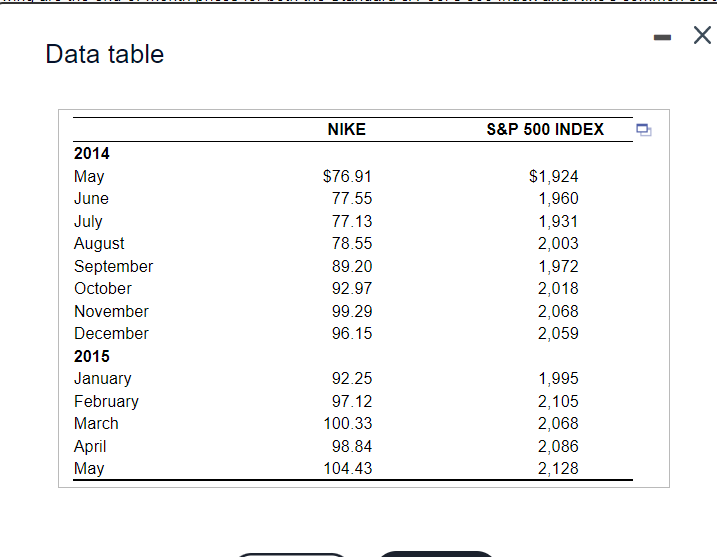
(Expected return, standard deviation, and capital asset pricing model) The following are the end-of-month prices for both the Standard & Poor's 500 Index and Nike's common stock. a. Using the data in the popup window, , calculate the holding-period returns for each of the months. b. Calculate the average monthly return and the standard deviation for both the S&P 500 and Nike. c. Develop a graph that shows the relationship between the Nike stock returns and the S&P 500 Index. (Show the Nike returns on the vertical axis and the S&P 500 Index returns on the horizontal axis.) d. From your graph, describe the nature of the relationship between Nike stock returns and the returns for the S&P 500 Index. a. Using the data in the table, calculate the holding-period returns for each of the months for both the Standard & Poor's 500 Index and Nike's common stock and fill in the blanks below. (Round to two decimal places.) NIKE NIKE RETURN S&P 500 INDEX S&P 500 RETURN 2014 May $76.91 $1,924 June 77.55 % 1,960 % Data table NIKE S&P 500 INDEX 2014 May June July August September October November December 2015 January February March April May $76.91 77.55 77.13 78.55 89.20 92.97 99.29 96.15 $1,924 1,960 1,931 2,003 1,972 2,018 2,068 2,059 92.25 97.12 100.33 98.84 104.43 1,995 2,105 2,068 2,086 2,128
Step by Step Solution
There are 3 Steps involved in it

Get step-by-step solutions from verified subject matter experts