

Question: please help answer a-d (Expected return, standard deviation, and capital asset pricing model) The following are the end-of-month prices for both the Standard & Poor's
please help answer a-d
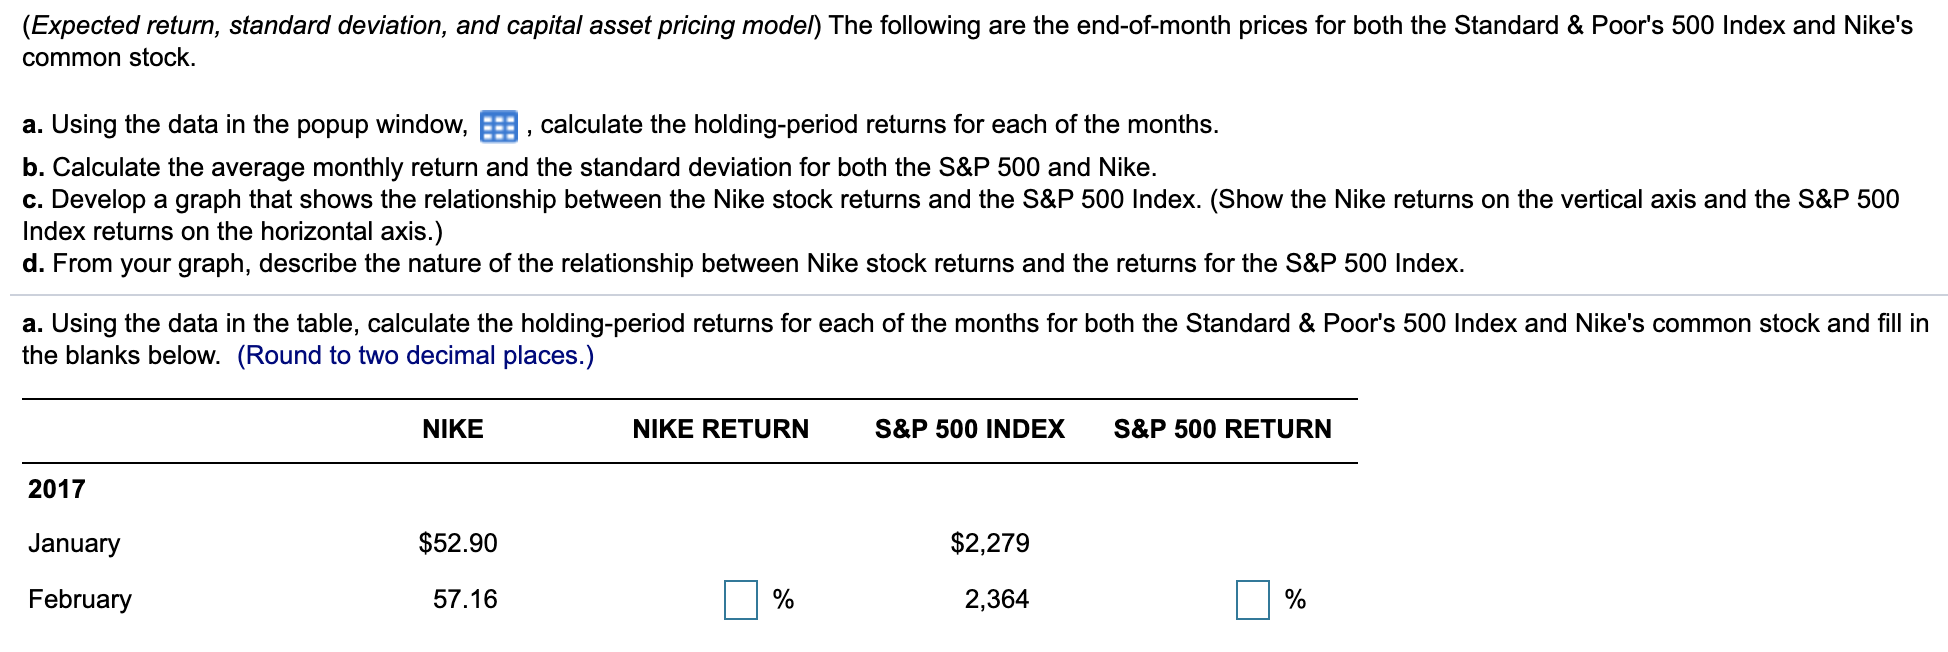
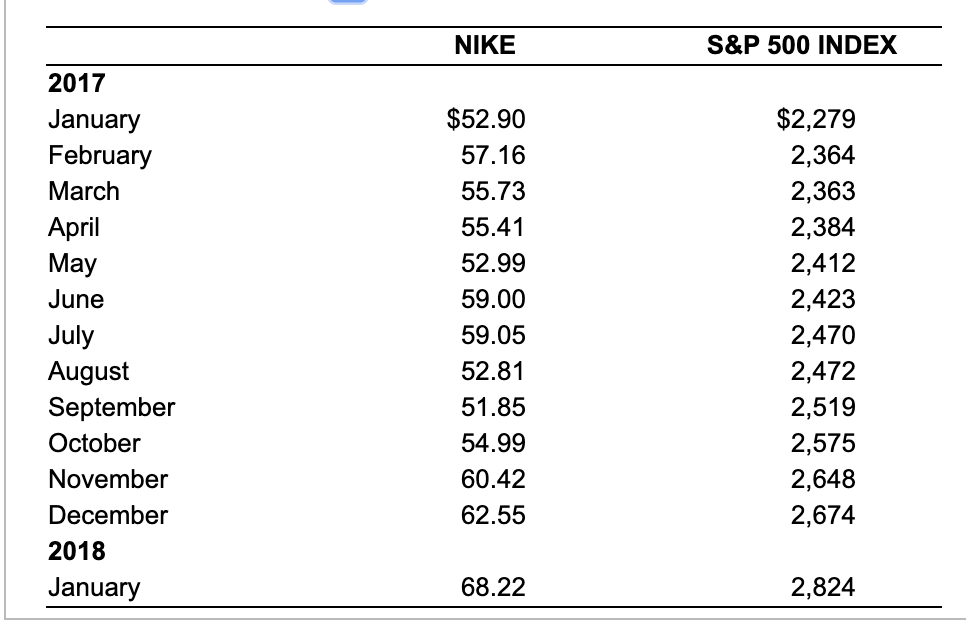
(Expected return, standard deviation, and capital asset pricing model) The following are the end-of-month prices for both the Standard & Poor's 500 Index and Nike's common stock , calculate the holding-period returns for each of the months. a. Using the data in the popup window, b. Calculate the average monthly return and the standard deviation for both the S&P 500 and Nike. c. Develop a graph that shows the relationship between the Nike stock returns and the S&P 500 Index. (Show the Nike returns on the vertical axis and the S&P 500 Index returns on the horizontal axis.) d. From your graph, describe the nature of the relationship between Nike stock returns and the returns for the S&P 500 Index a. Using the data in the table, calculate the holding-period returns for each of the months for both the Standard & Poor's 500 Index and Nike's common stock and fill in the blanks below. (Round to two decimal places.) NIKE NIKE RETURN S&P 500 INDEX S&P 500 RETURN 2017 $52.90 $2,279 January February 57.16 % 2,364 % NIKE S&P 500 INDEX 2017 $52.90 $2,279 January February 2,364 57.16 March 55.73 2,363 April 55.41 2,384 May 52.99 2,412 June 59.00 2,423 July August September 59.05 2,470 52.81 2,472 51.85 2,519 October 54.99 2,575 November 60.42 2,648 December 62.55 2,674 2018 January 68.22 2,824
Step by Step Solution
There are 3 Steps involved in it

Get step-by-step solutions from verified subject matter experts