

Question: Please answer all questions: 1. What are the obstacles associated with TQM implementation? Please provide an example to support your arguments.Please comment / respond on
Please answer all questions:
1. What are the obstacles associated with TQM implementation? Please provide an example to support your arguments.Please comment / respond on at least one paragraph by another student.
2. A manager of a caf hears complaints here and there from the customers about the new line of cheese cakes, but is not quite sure whats going on. Which process improvement tool could help the manager identify possible quality problems?
Select one:
a. Fishbone diagram
b. Check sheet
c. Control chart
d. Scatter diagram
3. The weights of 200 students are given below.
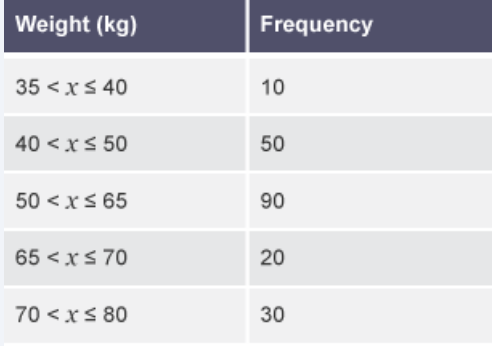
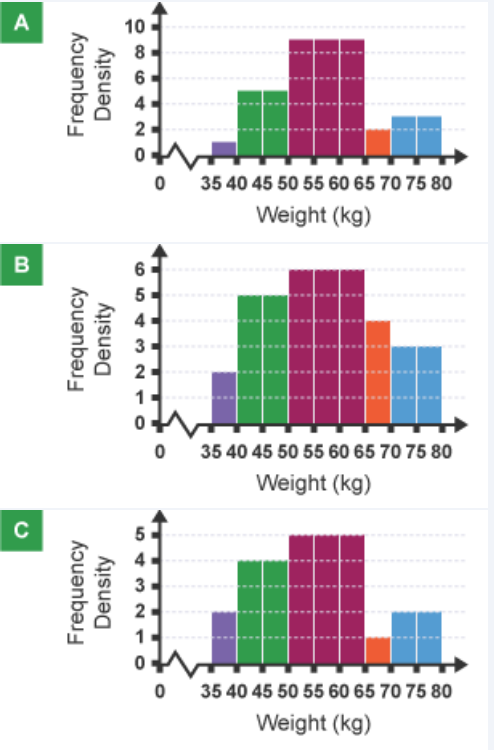
Which of the following histograms represents this data?
4. Draw a histogram for the following data:
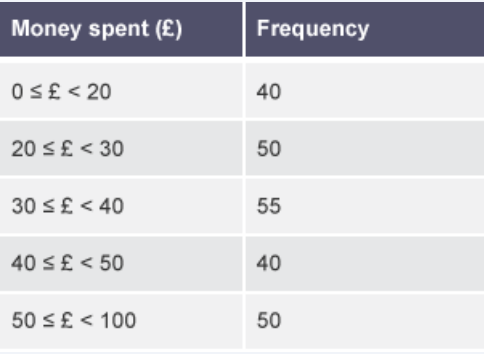
* Remember that we must calculate the frequency density for each group by dividing the frequency by the group width.
Weight (kg) Frequency 35Step by Step Solution
There are 3 Steps involved in it

Get step-by-step solutions from verified subject matter experts